
Nasdaq Technical Analysis: US Tech Market Structure, Elliott Wave Levels and Key Reaction Zones
Hi everyone, I hope you are all well. Below you can find the latest Nasdaq technical analysis, reviewing the US technology index across quarterly, monthly, weekly, daily and H4 timeframes.
This Nasdaq analysis focuses on market structure, trend context, Elliott Wave perspective, key technical levels, support and resistance areas, and possible reaction zones. The objective is not to predict the market with certainty, but to prepare structured scenarios and support a disciplined trading review process.
TradingWaves Journal is also being developed to help traders connect market analysis with trade review, risk tracking, execution quality, discipline, and long-term performance improvement.
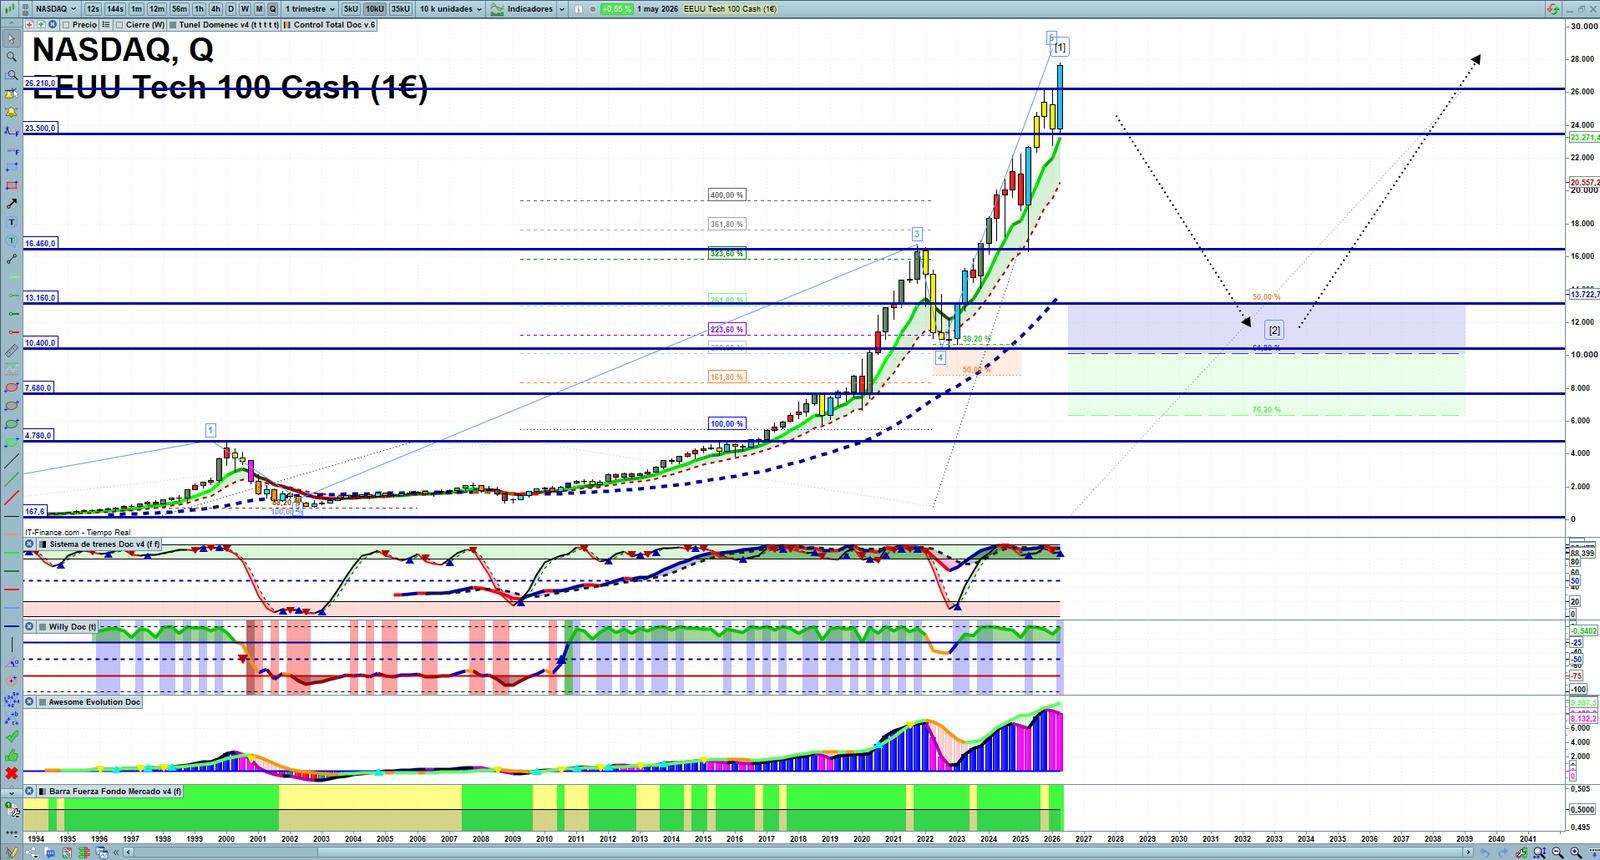
Nasdaq Quarterly Technical Analysis
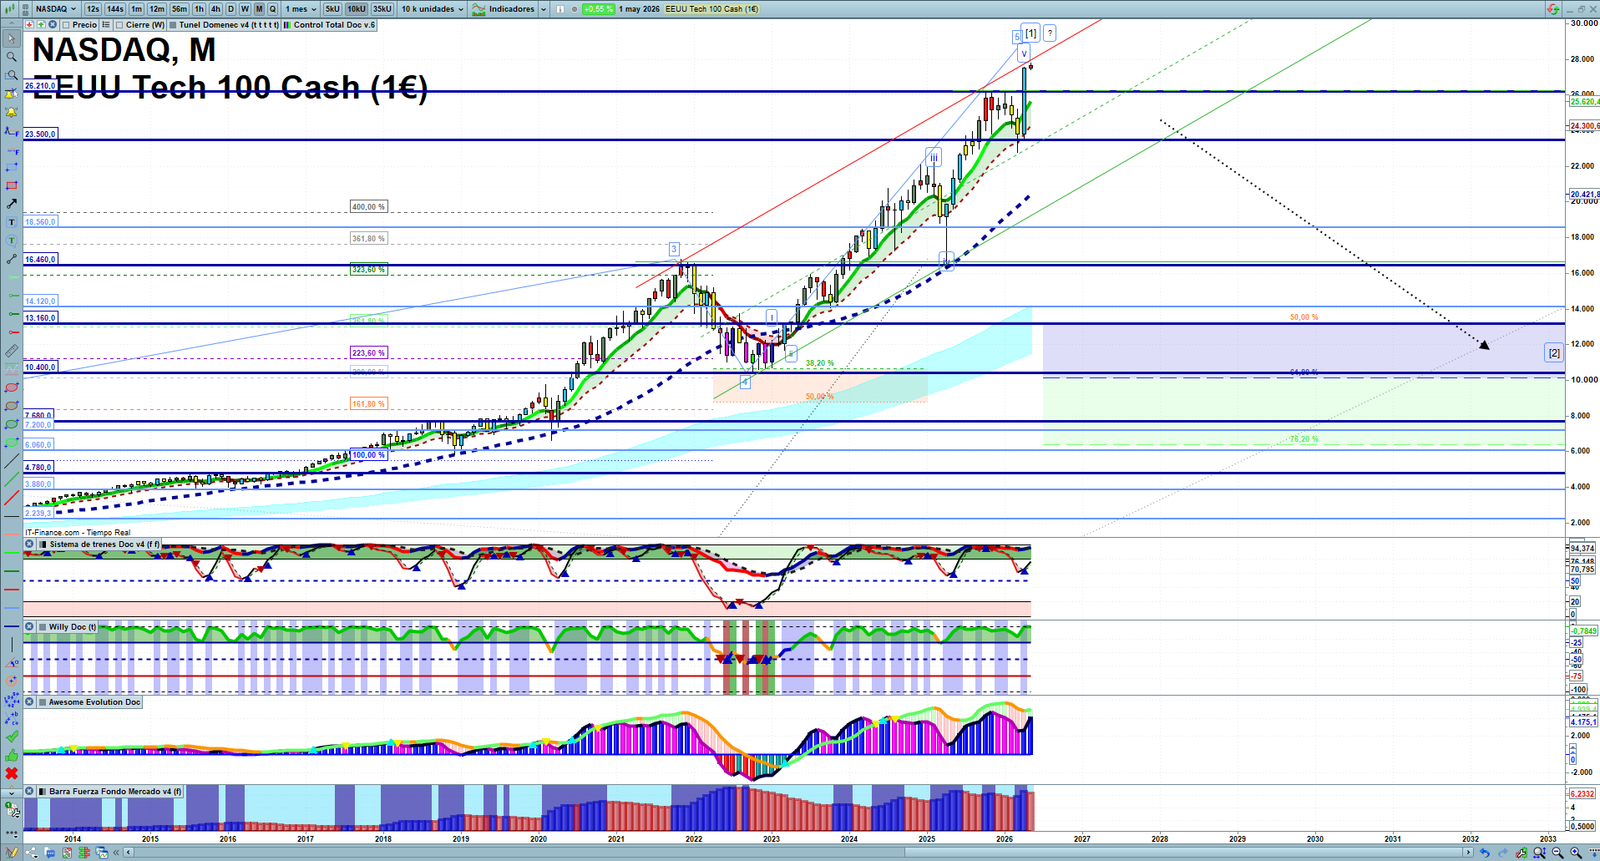
Nasdaq Monthly Technical Analysis
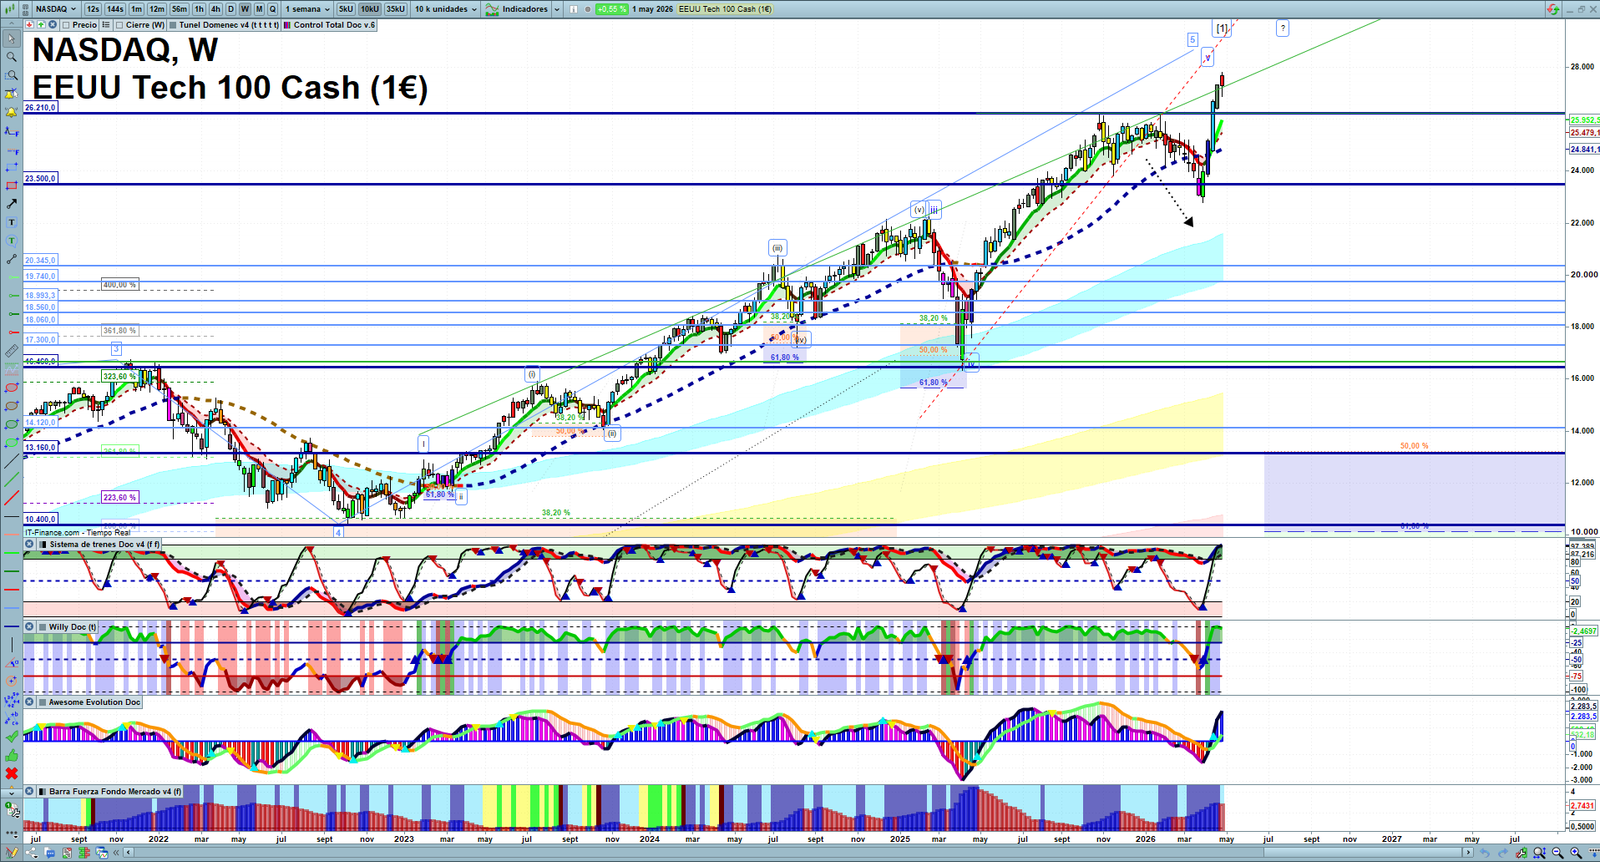
Nasdaq Weekly Technical Analysis
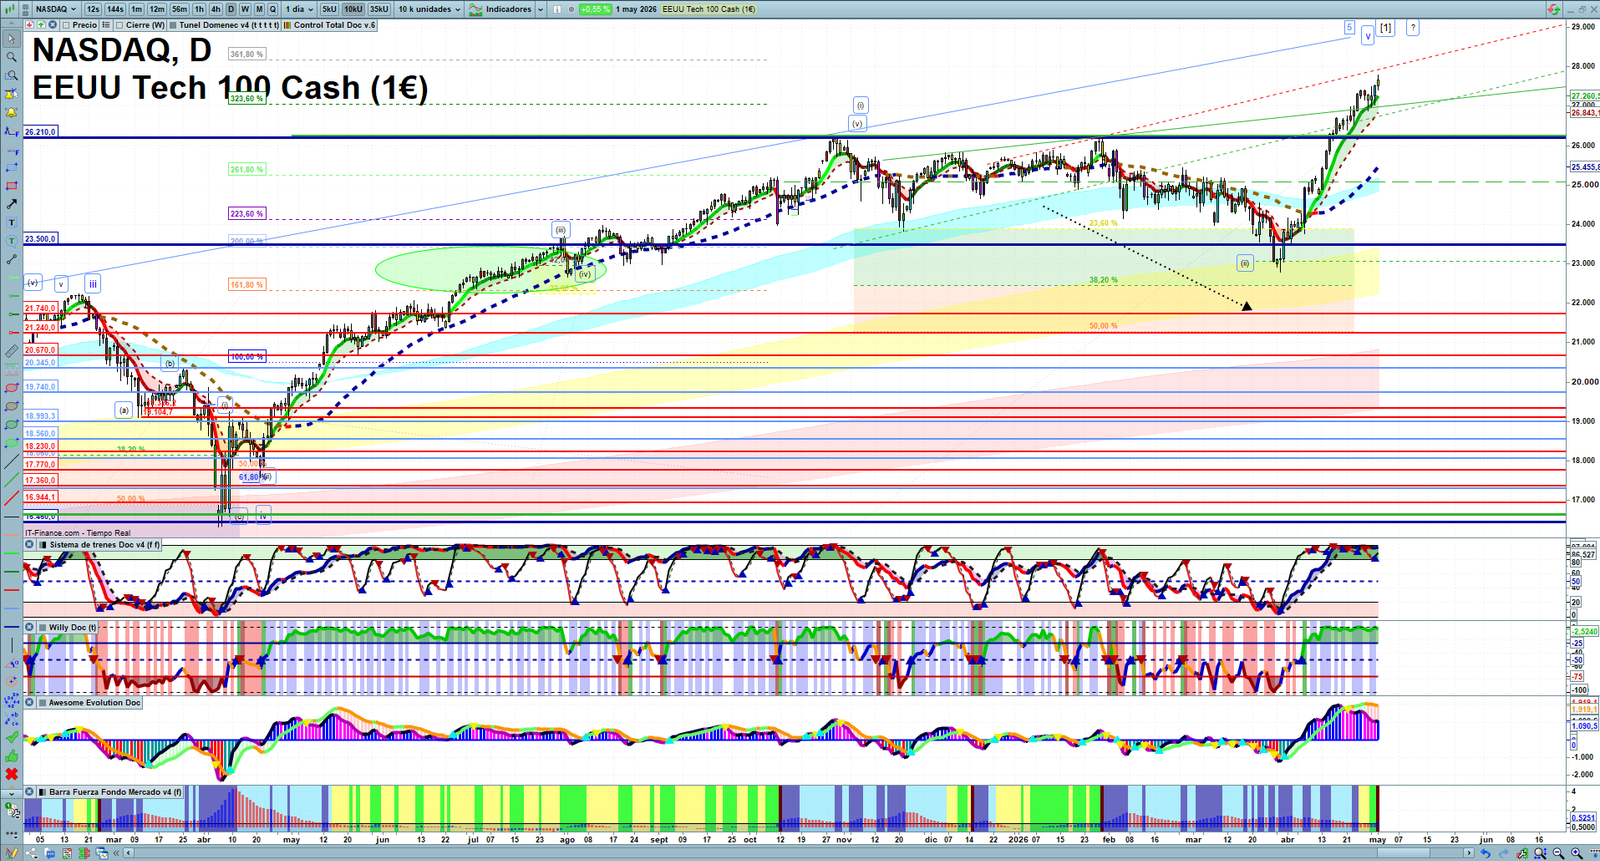
Nasdaq Daily Technical Analysis
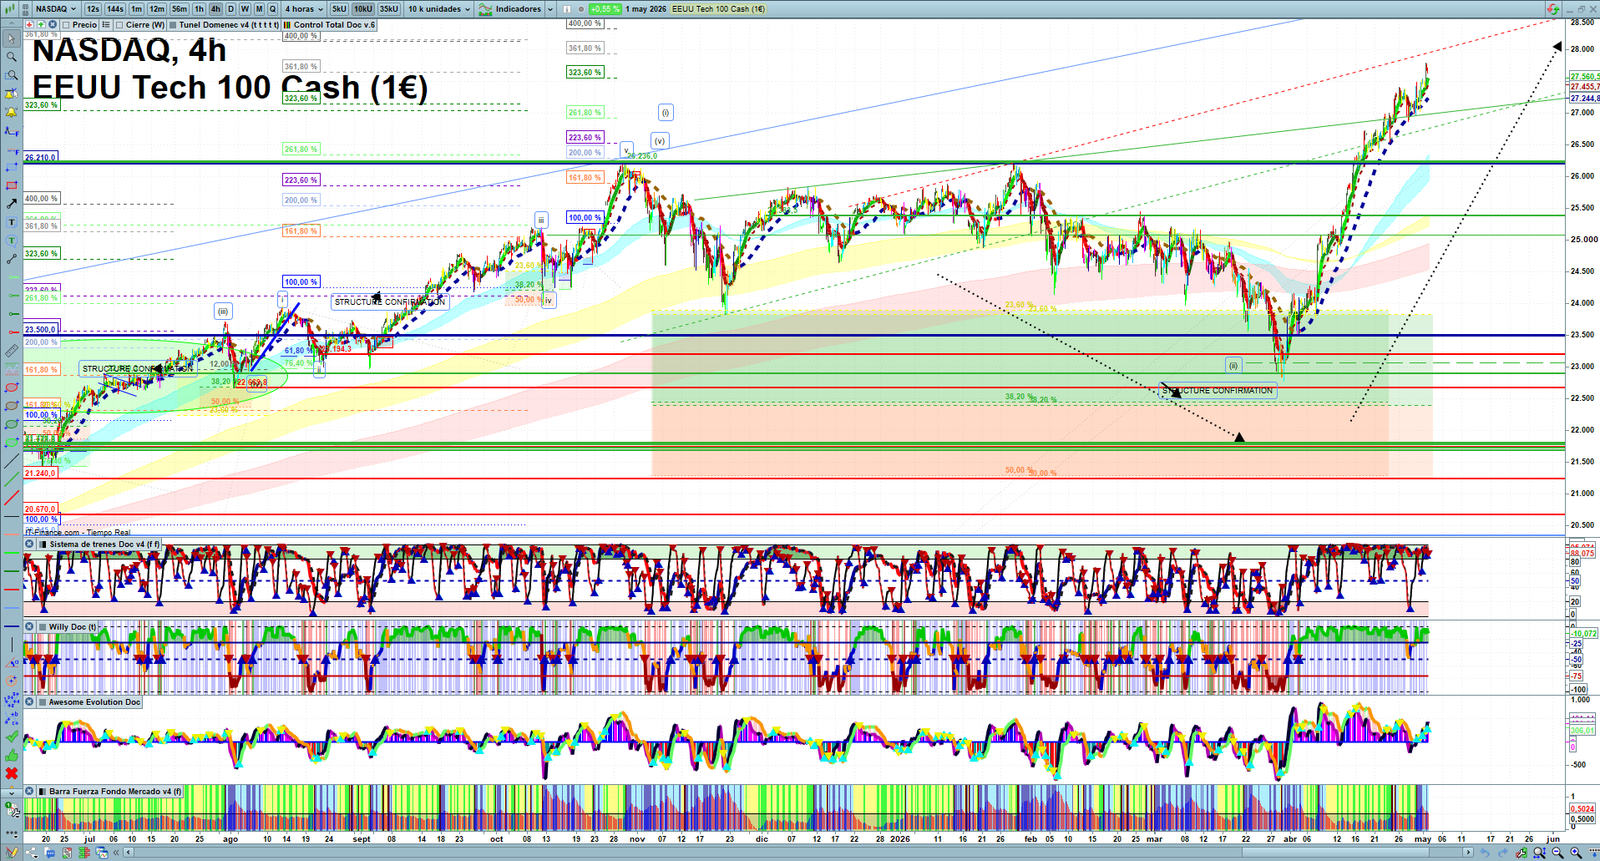
Nasdaq H4 Technical Analysis
For traders who follow this type of market structure analysis, the next step is reviewing how ideas are executed in real trades. TradingWaves Journal is coming soon as a structured trading journal for tracking trades, risk, discipline, execution quality and performance review.
Join the early access interest list here: TradingWaves Journal Early Access
All the best to everyone, and please do not hesitate to contact me if you have any questions or comments.
Andres
info@tradingwaves.org
Please be aware: this analysis reflects personal market opinions and is provided for educational purposes only. It is not trading advice or investment advice. Trading carries a high level of risk and may not be suitable for all investors. Before deciding to trade, you should carefully consider your investment objectives, level of experience, and risk appetite.