Wed 10-04-2019
Hi everyone, hope you are all ok.
USDJPY
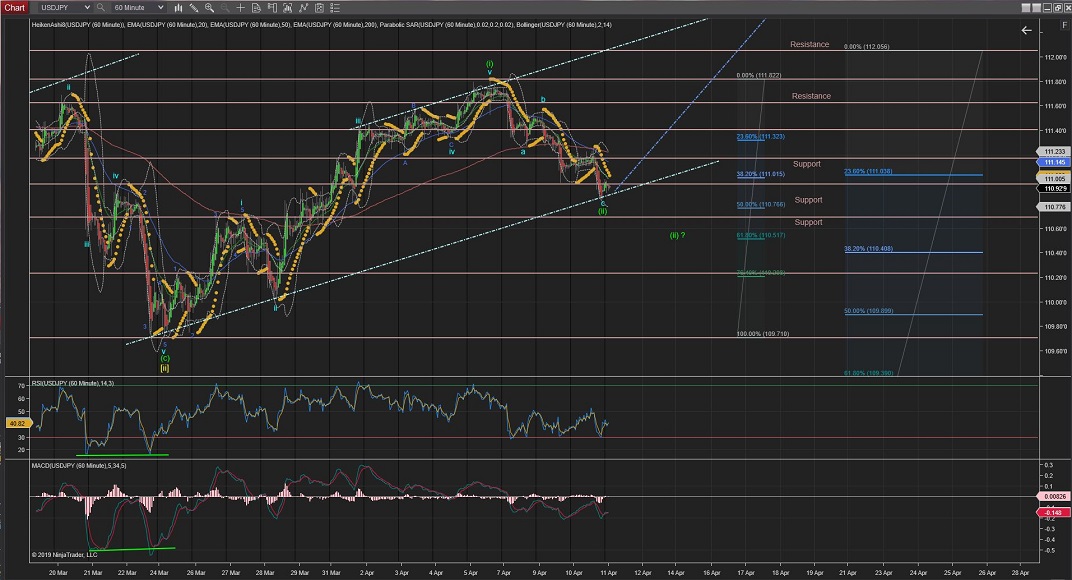
USDJPY Wave (ii) correction reached very near the %50Fib Retracement of Wave (i) in 5 Waves down.
The fact that Wave c shows 5 completed internal waves suggest the idea that it has complted Wave (ii).
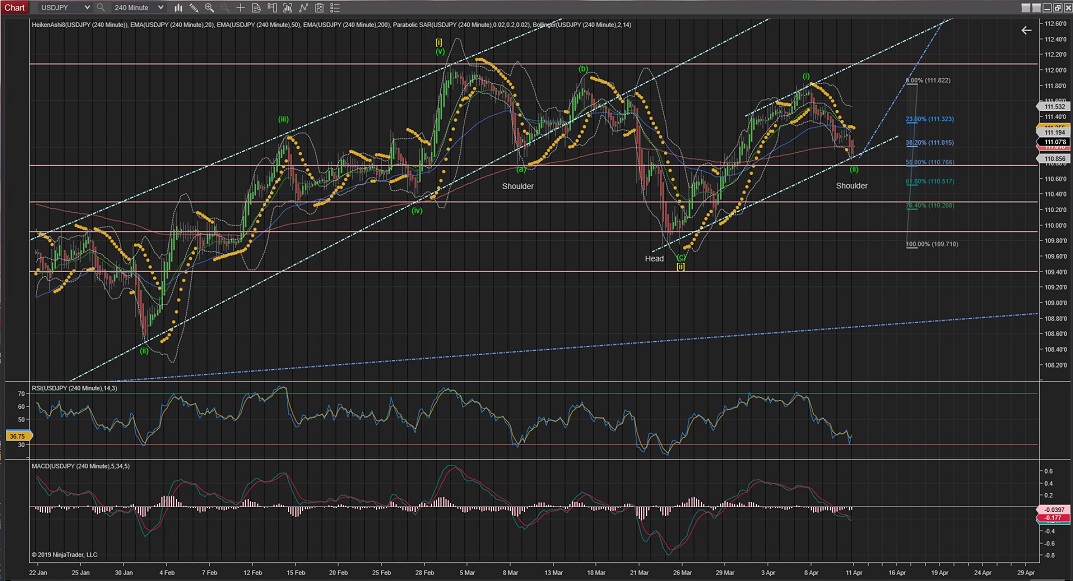
At the same time the 4Hour Chart shows a potential Head & Shoulder formation with the highest of Wave (i) being the neckline.
If the price crosses the trend line (light-blue) the next support level would be between %50 and %62Fib retracement.
Once Wave (ii) is completed we should expect the rise of Wave (iii) (of Wave [iii]) to carry the price up impulsively again.
60Mins
4Hours
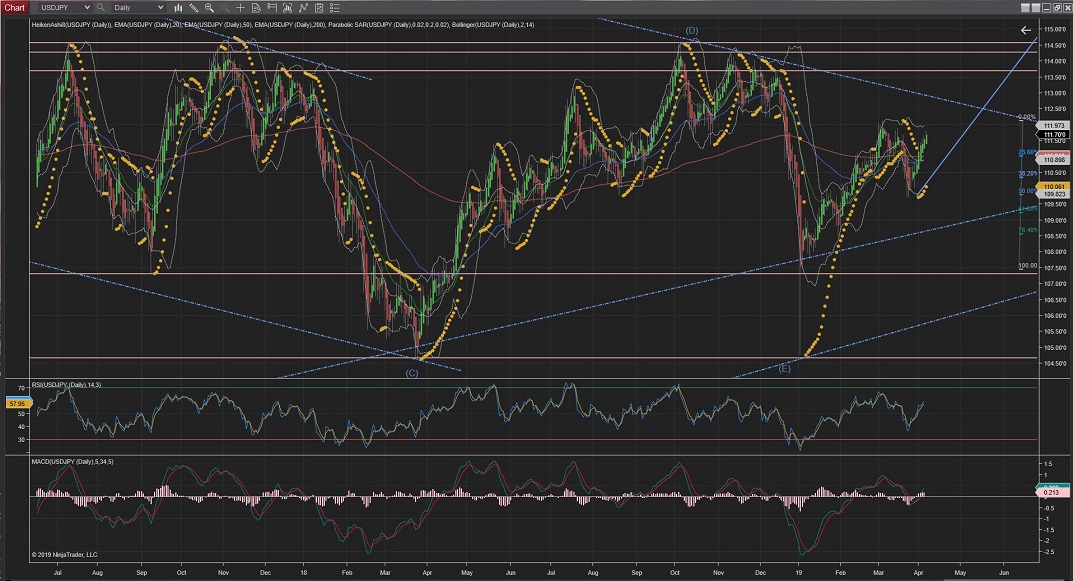
Daily
Weekly
USDCAD
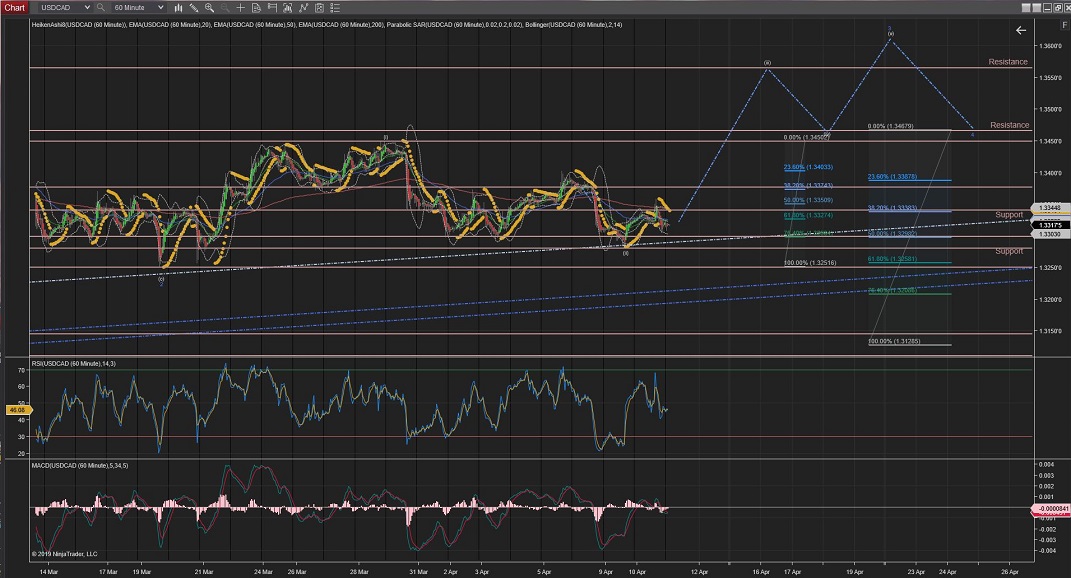
USDCAD correction of Wave (ii) completed at the %76 Fib levels.
Today it has moved up with a slightly impulsive Wave up for a internal Wave (iii) of Wave 3(blue).
Wave (iii) will only be confirmed when it crosses the highest of Wave (i) at 1.3450 and carries the price higher.
At the moment it seems to have developed two internal waves within Wave (iii) on the way up.
There is currently a correction to the downside and should raise up again to continue the trend upwards through Wave (iii) of Wave 3 (blue).
60Mins
4Hours
Daily
USDCHF
USDCHF broke out of the triangle to the upside and stopped at the second resistance now at 1.0033.
The move has shown some impulsive moves to the upside but I haven't change the current count as I still consider the move corrective in nature and there could be a final drop towards the long-term trend line.
If the price carries on upwards through the resistances in the form of 5 clear waves it will indicate that Wave c of Wave (c) of Wave [ii] has been already completed and this is the start of the series of waves for Wave [iii].
If the price drops lower again towards the lower trend (blue), the current count would still be valid for an extended Wave c.
Regardless of the starting point for the raise, on the long term, the price is bound to raise impulsively for Wave [iii] .
60Mins
4Hours
Daily
EURUSD
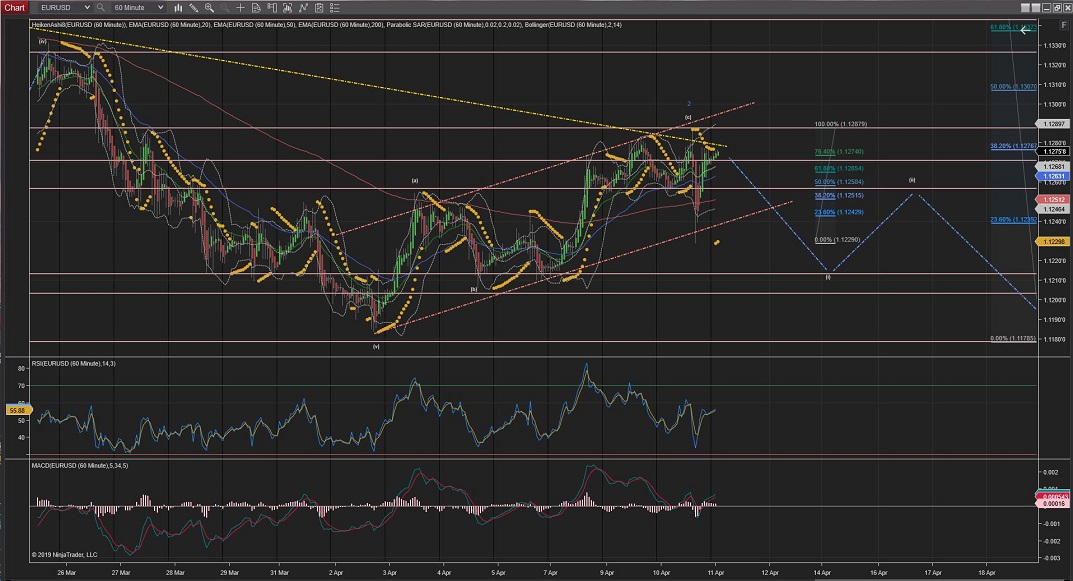
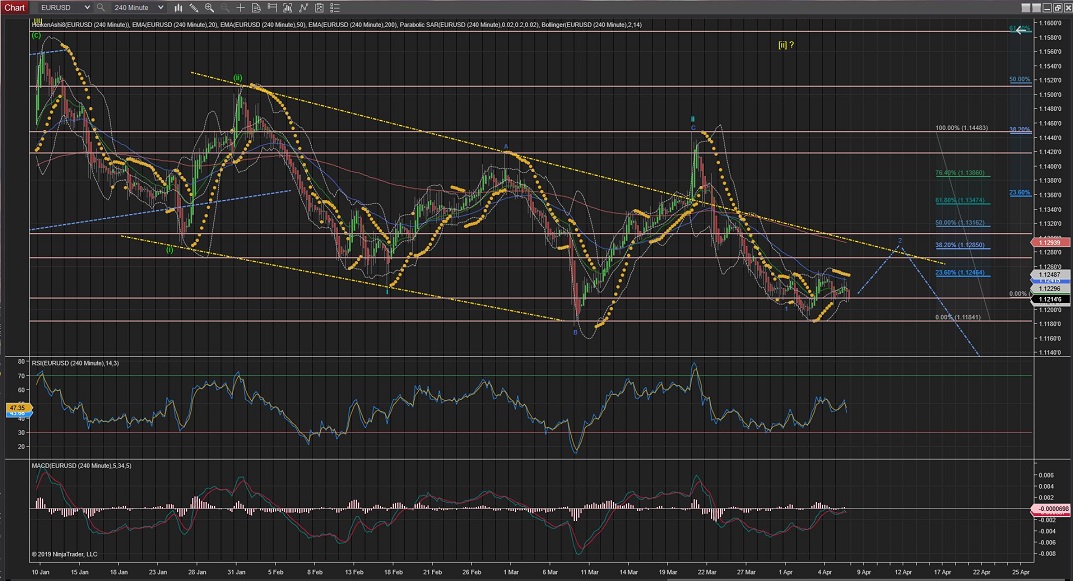
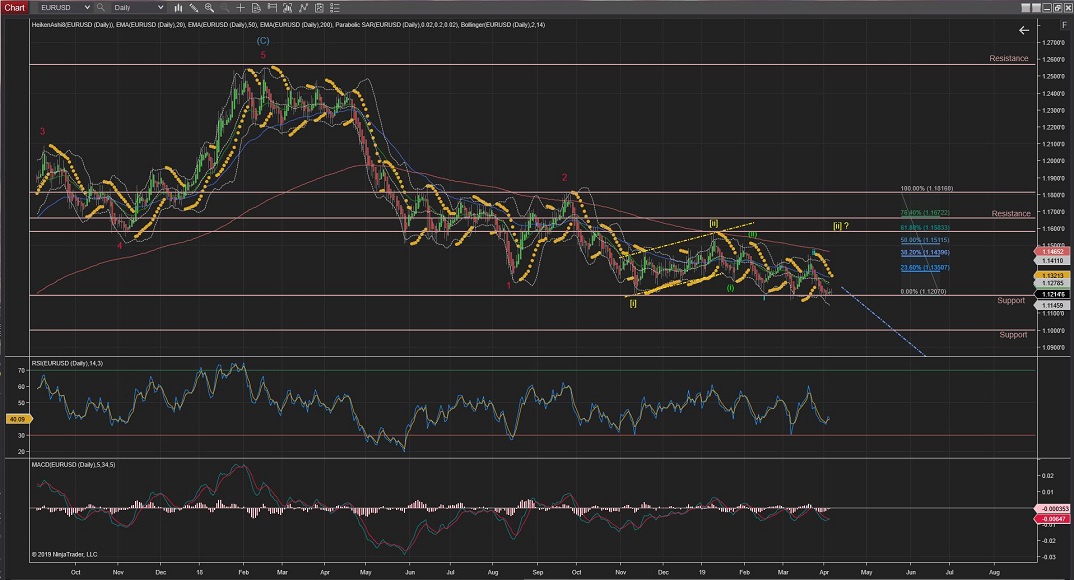
EURUSD today seem to have completed Wave 2 (blue) correction with its last internal Wave (c) bouncing off the internal (red) trend (at just above the%38Fib retracement of Wave 1).
Wave 3 (of Wave iii) had an initial impulsive wave to the downside and corrected the move slightly more than %76.
Further moves up from todays high at 1.12897 would imply Wave 2 is still in play for a greater retracement.
Next, as per current count, Wave 3 should continue to move down impulsively across the trend line (light-red) and support levels.
60Mins
4Hours
Daily
EURCHF
EURCHF Wave iii might have completed 5 internal waves although it could be extended to the next resistance level at 1.1320 area.
Next Wave iv should develop a correction towards support levels and then Wave 5 should carry the price higher towards the next resistance level at the 1.1300 area to complete Wave (i).
60Mins
4Hours
Daily
EURGBP
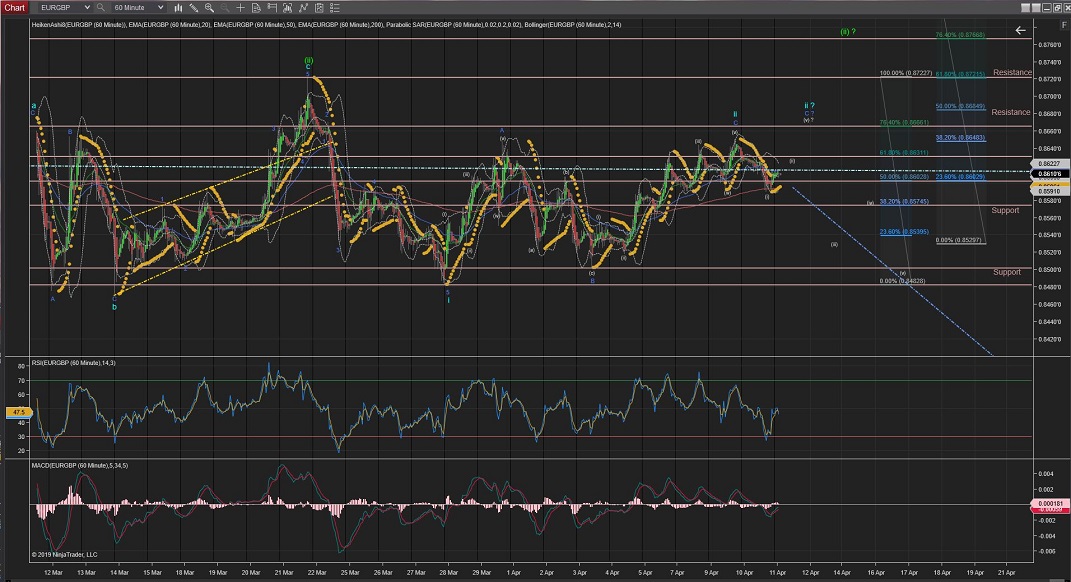
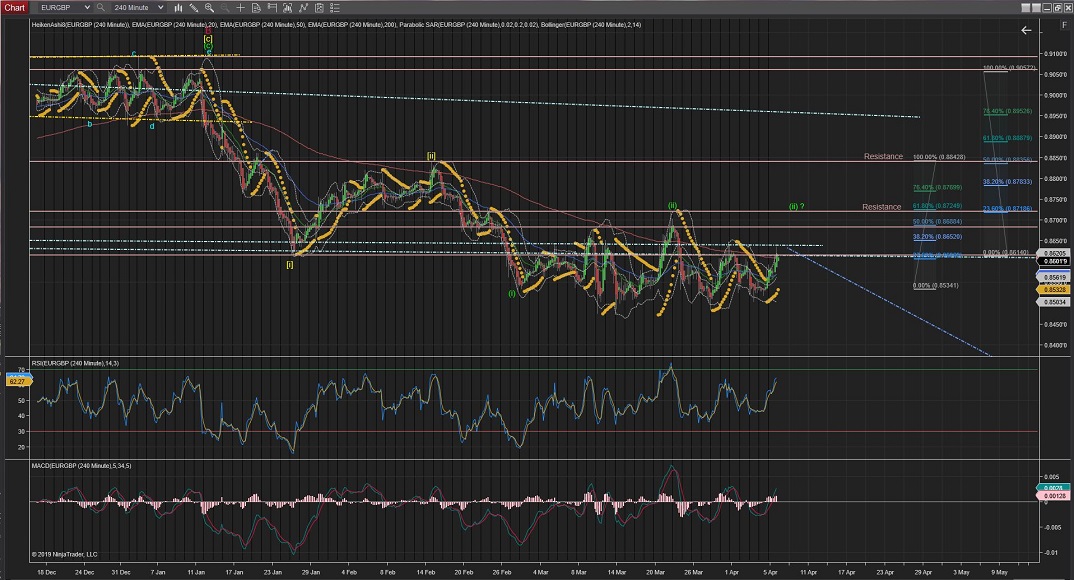
EURGBP Wave 2 is showing a ZigZag (5,3,5) correction possibly extending further to complete at the %76 Fibonacci retracement of Wave 1.
Note if the price crosses higher than the 0Fib retracement it would trigger the alternative count of a Wave (ii) going towards the %62Fib level again or higher at the %76.
If the current count is correct, Wave 3 should continue the waves down taking the price below the lowest of Wave 1 at 0.8500.
60Mins
4Hours
Daily
Weekly
GBPUSD
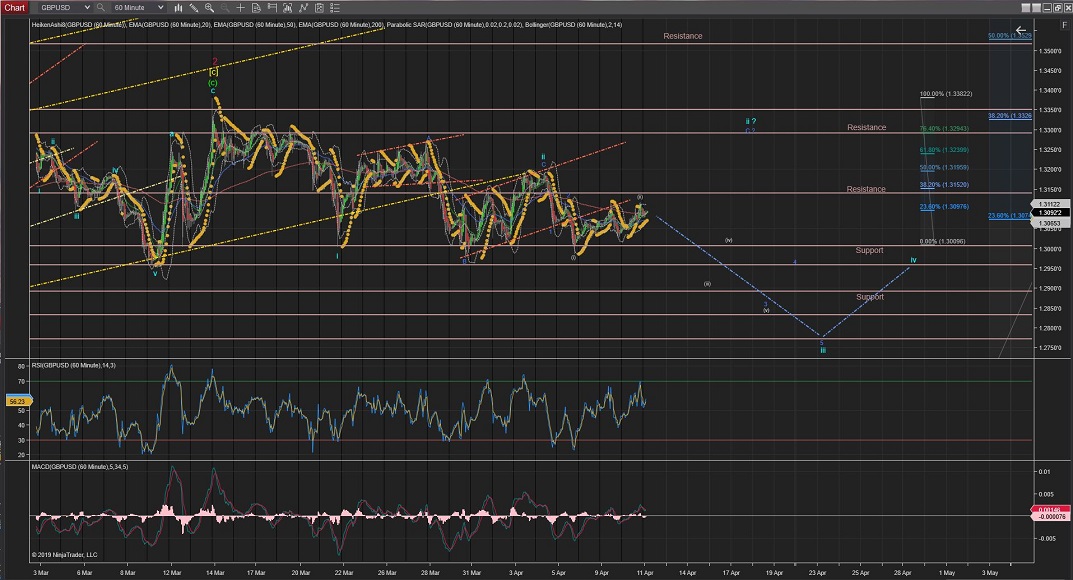
GBPUSD is moving in a very undecided fashion.
Wave ii reached the %50Fib retracement of Wave i and dropped sharply.
This sharp drop suggest that Wave ii could have been completed and Wave iii is underway.
Since then the possible Wave iii down seems to be going through its internal Wave (ii) correction and, once completed, should carry on with the impulsive waves downwards.
(Notice that if the price crosses the red trend it would suggest that Wave ii correction is still in play and price might raise towards resistances at the 1.3300 area again)
60Mins
4Hours
Daily
AUDUSD
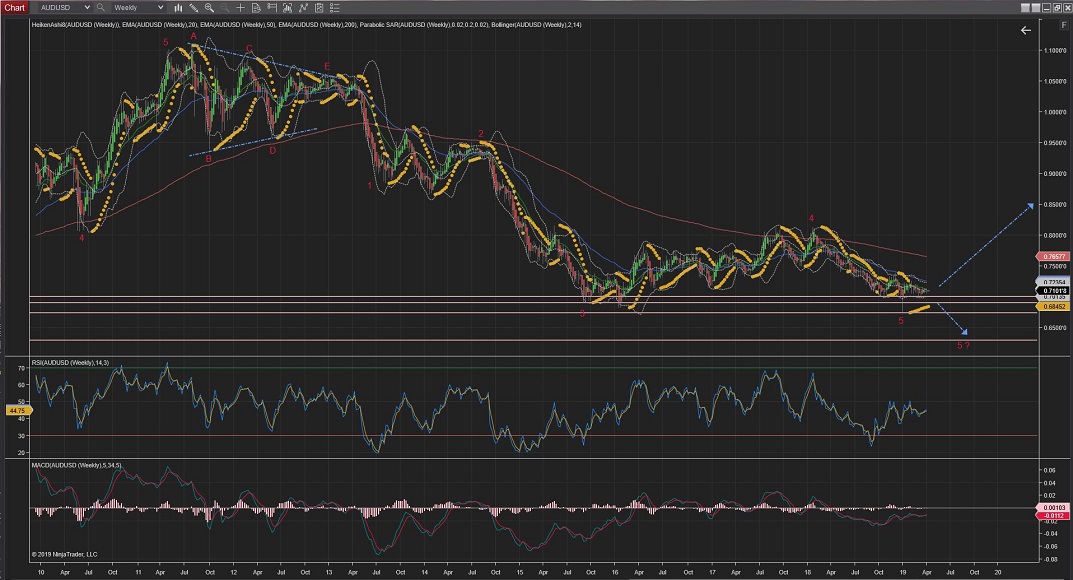
Daily & 4Hour Charts:
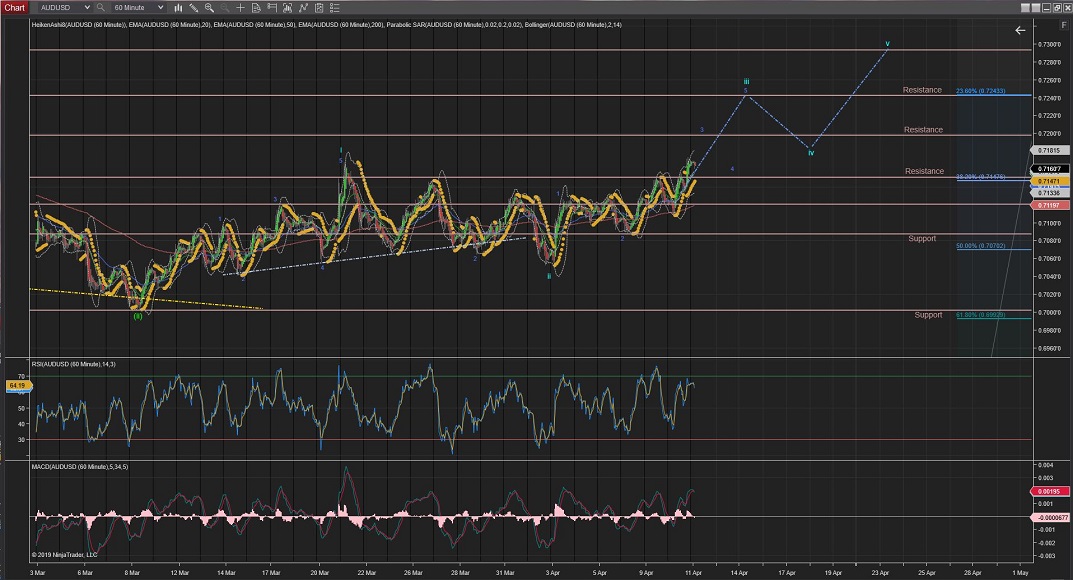
AUDUSD 4Hour Chart is showing the price raising from the neckline of a clear Head & Shoulders pattern which is suggesting Wave (iii) could be finally making its way up.
Still not out of the woods yet, so further moves lower than this neckline would trigger the alternative count for an extended Wave [ii] going towards the %76 levels of support, although it is still possible an extended Wave [v] or even a further extended Wave 5, with not much resistance levels to stop the move down (best seen in the 4Hour and Daily charts) .
Hourly Chart:
Next, Wave iii should continue the remaining of its 5 internal waves up, possibly tothe next resistance level around the 0.7200 area.
From there, Wave 4 should do another correction in price before Wave 5 takes the price higher to complete Wave iii.
60Mins
4Hours
Daily
Weekly
All the best for everyone.
Andres


 Trading Waves .org