Wed 20-03-2019
Hi everyone, hope you are all ok.
USDJPY
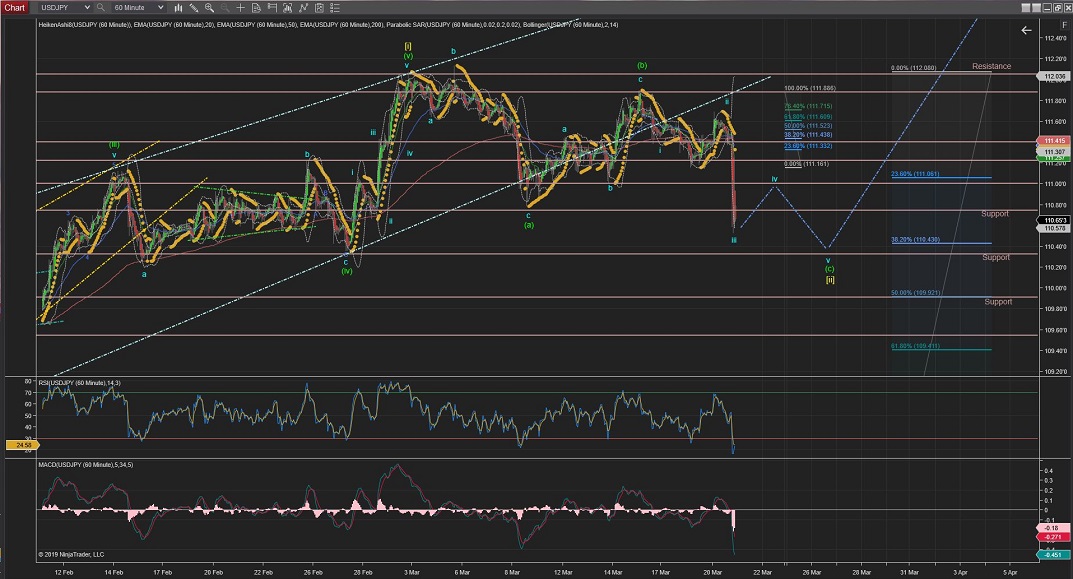
USDJPY has completed Wave iii of corrective Wave (c) (of Wave [ii]), as shown in the 60Min and 4Hour Charts).
I would expect a corrective Wave iv to raise soon (possibly towards the 111.00 area) and then Wave v to drop lower again to support area towards lower support levels (%38Fib at 110.40 or %50Fib at the 110.00 levels).
60Mins
4Hours
Daily
Weekly
USDCAD
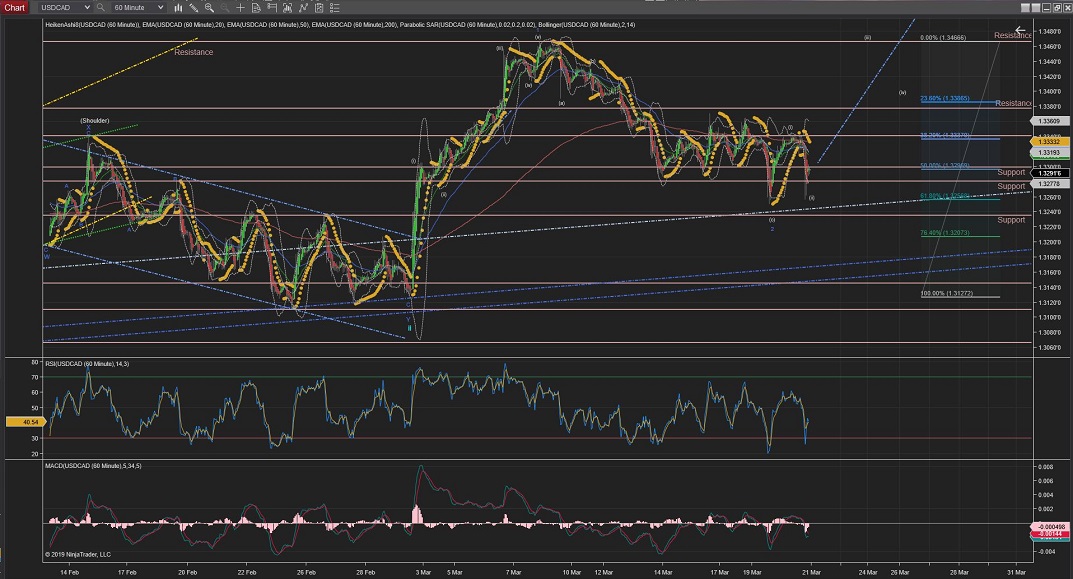
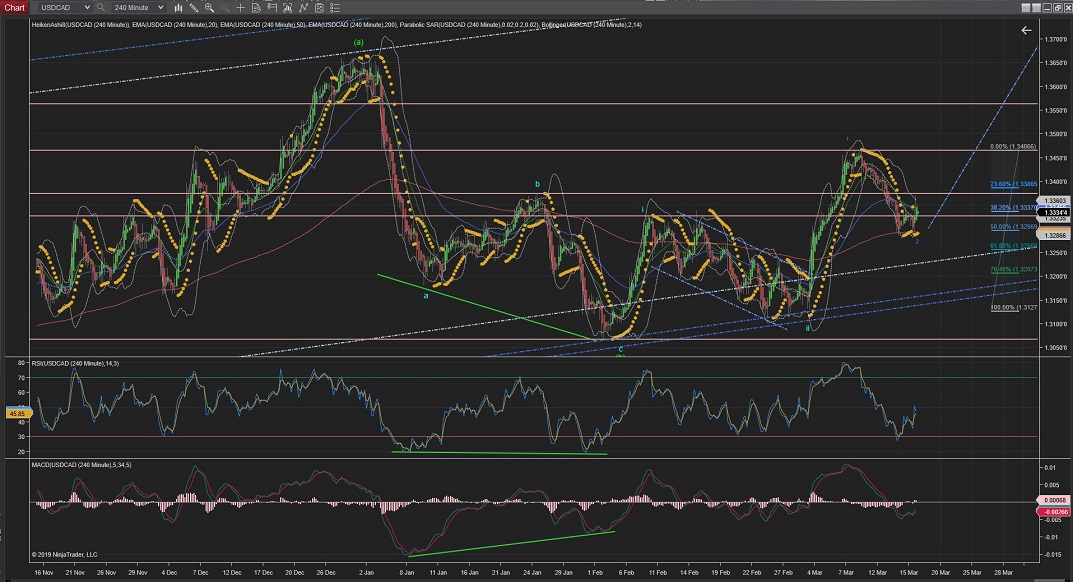
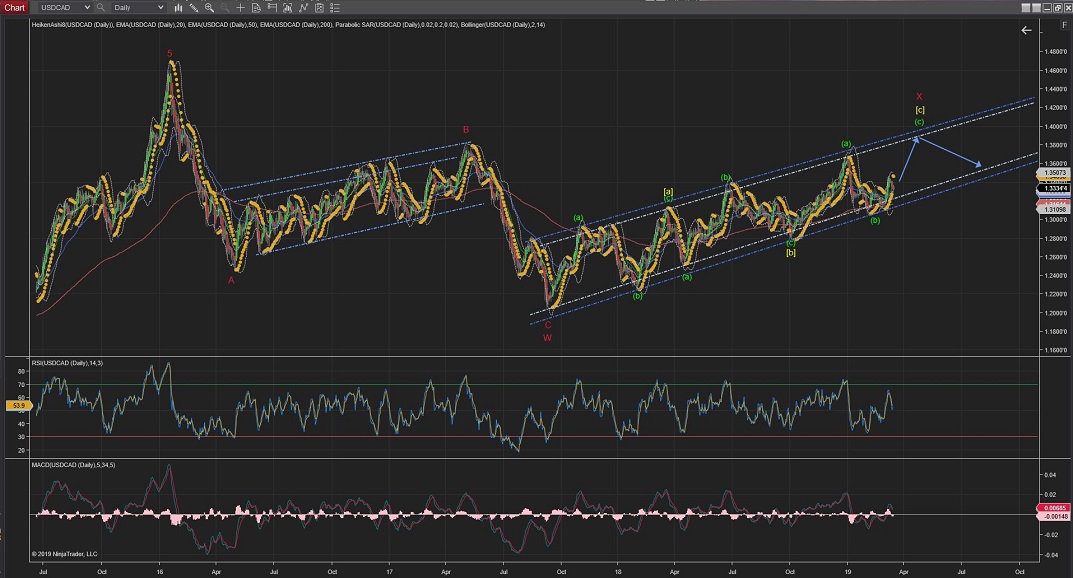
USDCAD completed Wave (ii) of Wave 3 and I would expect to start Wave (iii) with impulsive moves up soon for this count to be a valid one.
Wave 3(blue) will be confirmed as soon as it crosses the highest of Wave 1(blue) at 1.3466.
60Mins
4Hours
Daily
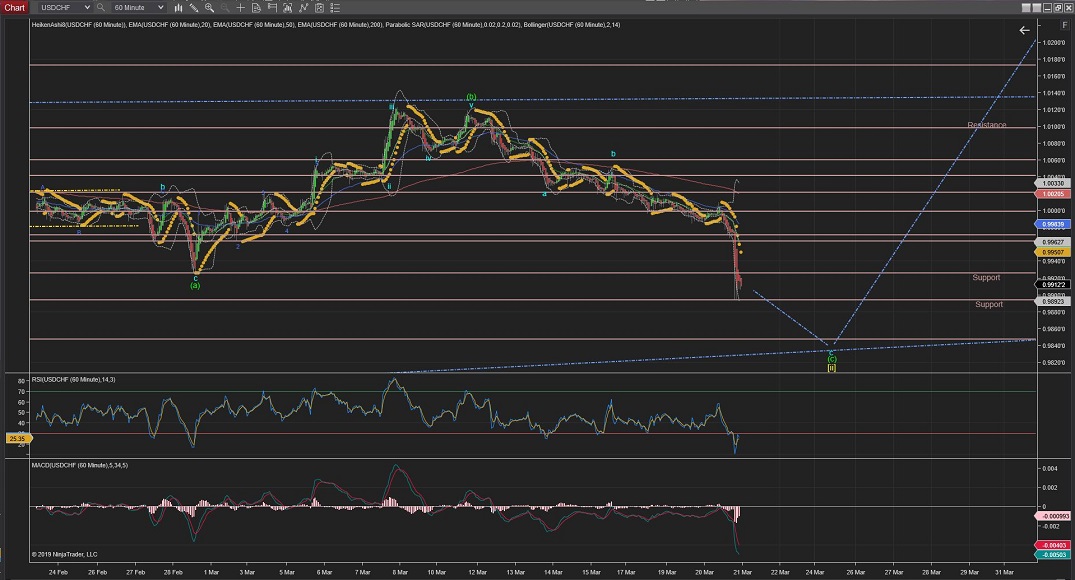
USDCHF
USDCHF triggered the alternative count for a larger Wave [ii] today.
The price is heading down towards the lower long-term trend again to complete Wave [ii] at the %62 Fib retracement (best shown in the 4Hour Chart).
60Mins
4Hours
Daily
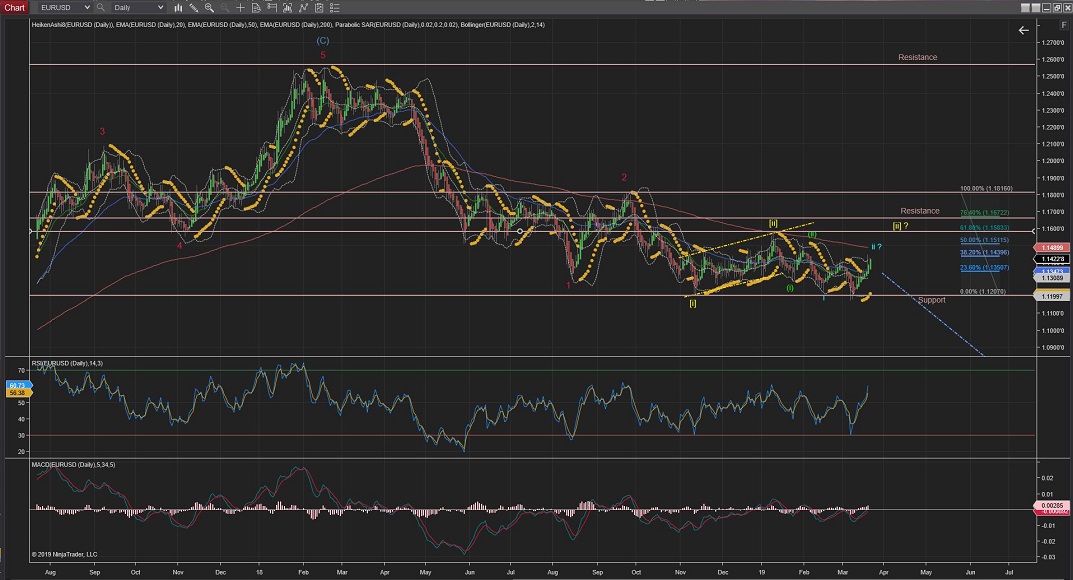
EURUSD
EURUSD today has invalidated the count that I had with the most bearish outlook and it has raised instead for a possible Wave ii correction to be completed at the %76 Fib retracement, if it completes at this point.
If the price starts moving downwards impulsively it would suggest that Wave iii down has finally started.
Although, if the price carries on raising it would call for an extended Wave [ii] correction (best shown on the 4Hour and Daily Charts) towards the %62 Fib retracement (at the 1.1584 area).
60Mins
4Hours
Daily
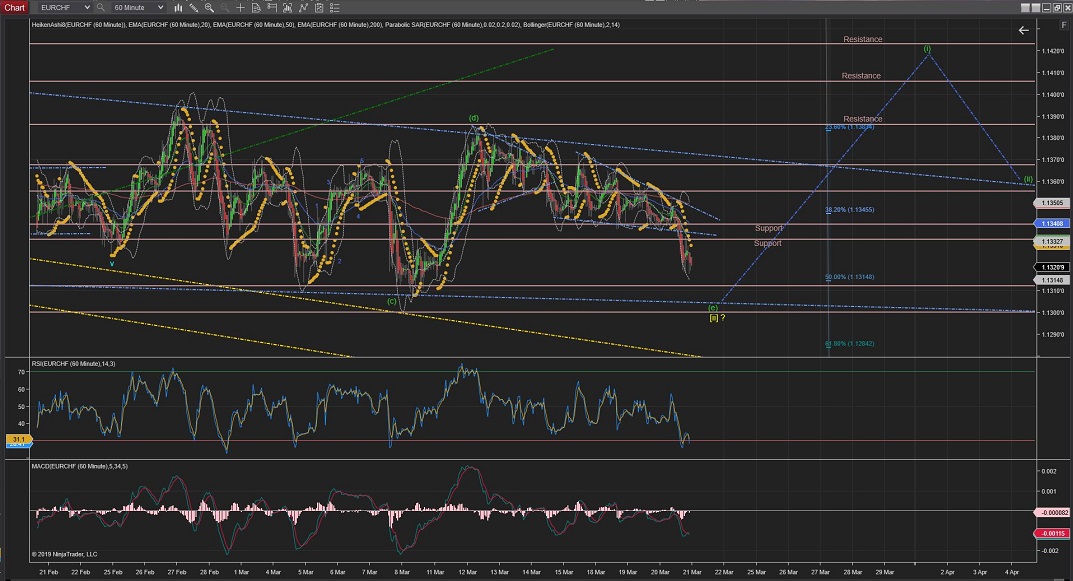
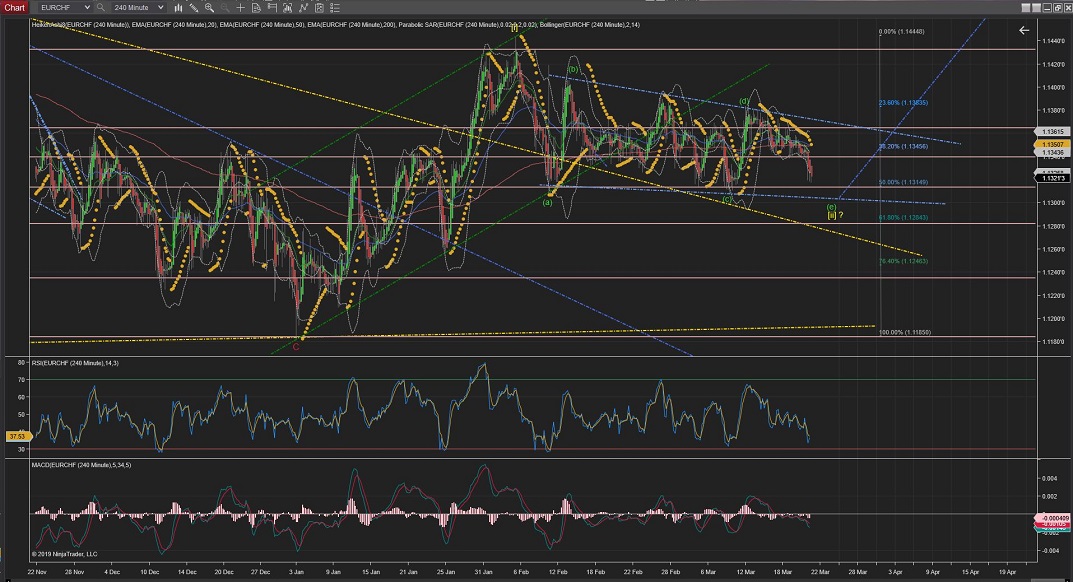
EURCHF
EURCHF triggered an alternative count and I find that a a contracting triangle fits the current Wave [ii] correction.
As per current count, the price should turn around upon completion of Wave (e) when it hits the triangle lower trend line at the 1.1300 area (as shown in the 60Min and 4Hour Charts.
This would mean that Wave [ii] will be complete between the %50 and the %62Fib retracement levels.
Strong impulsive waves up from that trend would confirm that count.
60Mins
4Hours
Daily
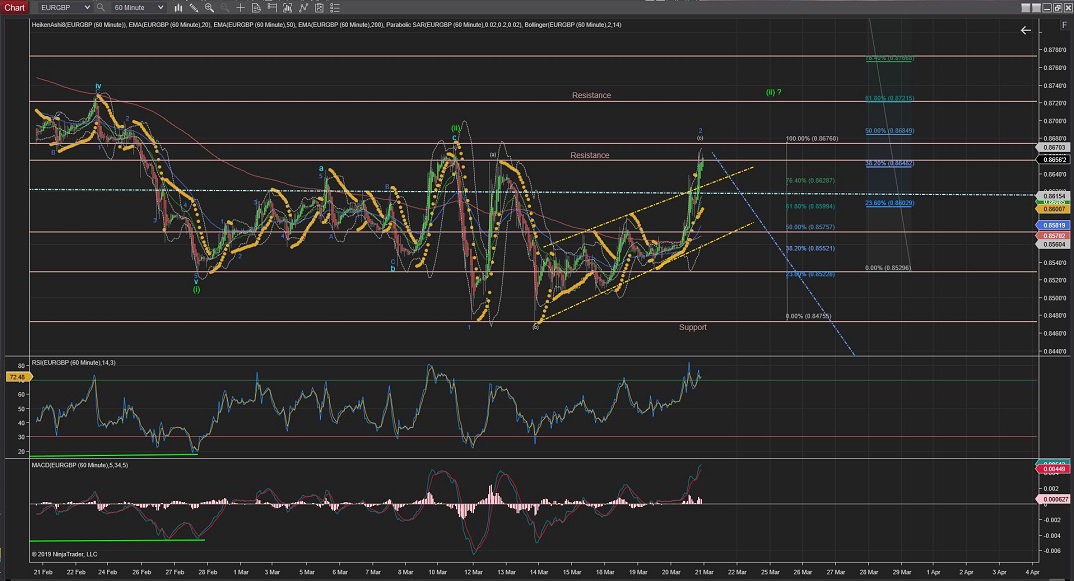
EURGBP
EURGBP is very close now to invalidate the current count for corrective Wave 2 almost reaching the 0 Fib retracement (at 0.8674).
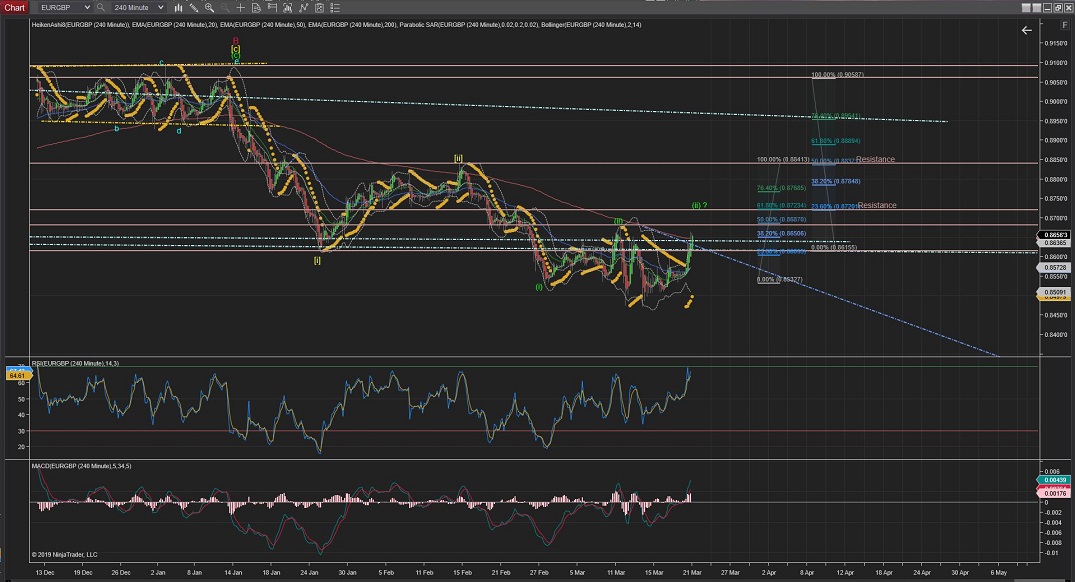
Any move up further than the highest of Wave (ii) would trigger the alternate count for an extended Wave (ii) going towards the %62Fib retracement (at the 0.8720 area).
As the current count stands I would expect to continue higher and then a breakout of this trend (yellow) to the downside for Wave 3 to continue its way down through Wave (iii).
(this count would only be confirmed once it crosses the lowest of Wave 1).
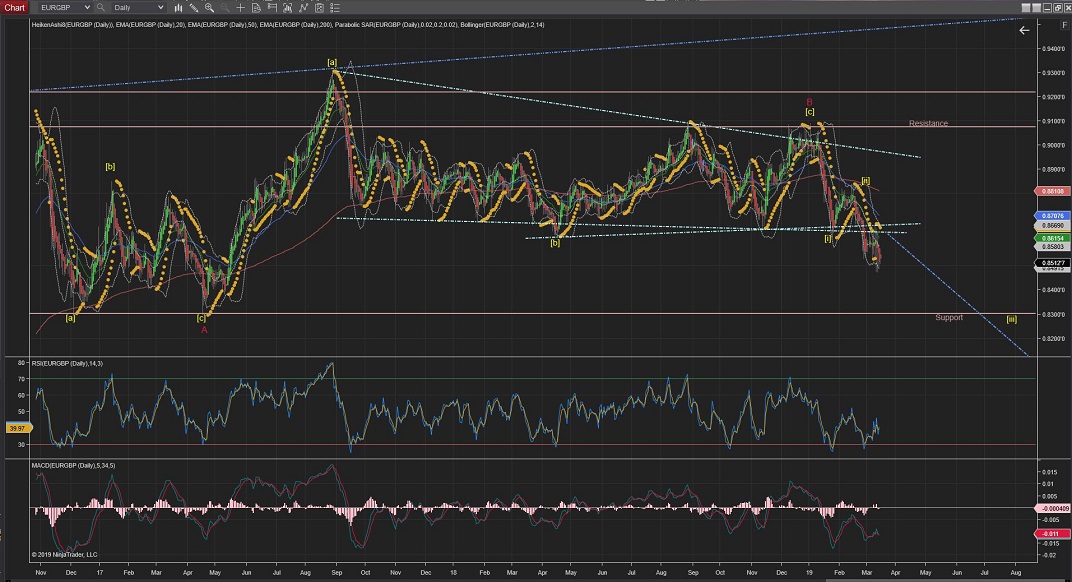
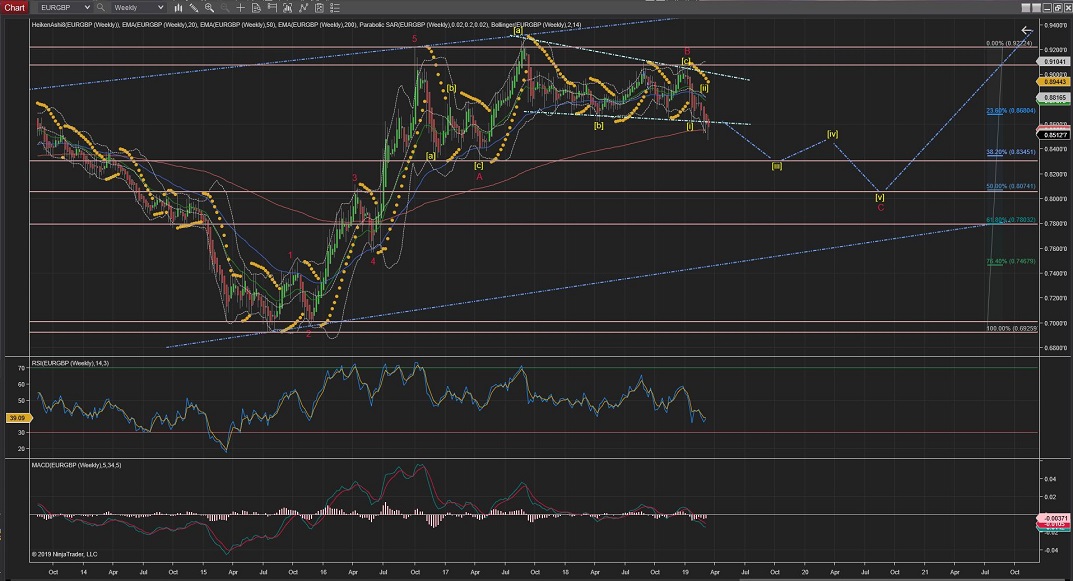
And the next biggest support level after 0.8473, as the Daily chart shows is 0.8300 (as a target for Wave [iii].
(the 0 length of Wave (i) to the downside that Wave (iii) could see as target would be on the 0.8400 area).
60Mins
4Hours
Daily
Weekly
GBPUSD
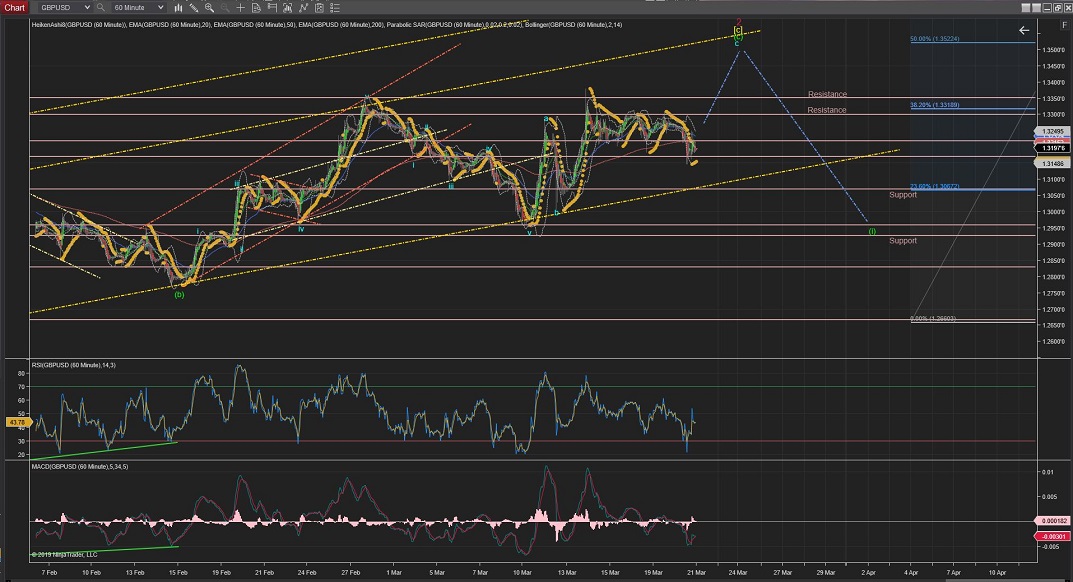
GBPUSD still has not shown much price action moving sideways into what appears to still be a corrective Wave c of Wave (c).
And still potential for heading up towards the 1.3500 area (best pictured in the daily and 4Hour Charts) for the %50 Fib retracement area, although could also go higher for %62, if it breaks through the trade line (yellow).
If it resumes the raising now it would have completed Wave 2(red) just above the %38.
Once the correction is completed, the price should start showing impulsive waves to the down side for a long term Wave 3 (red) to start.
60Mins
4Hours
Daily
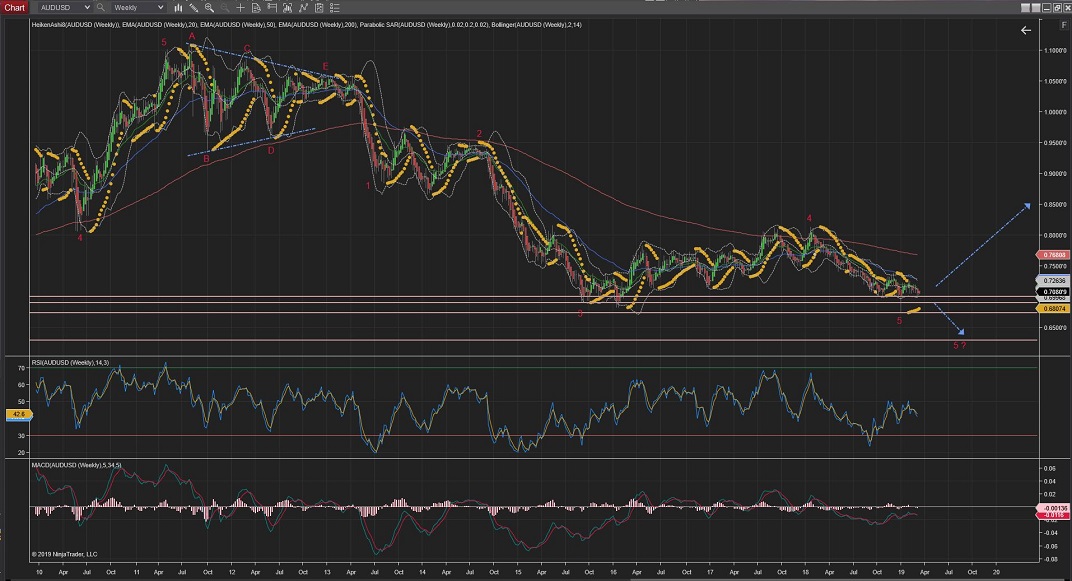
AUDUSD
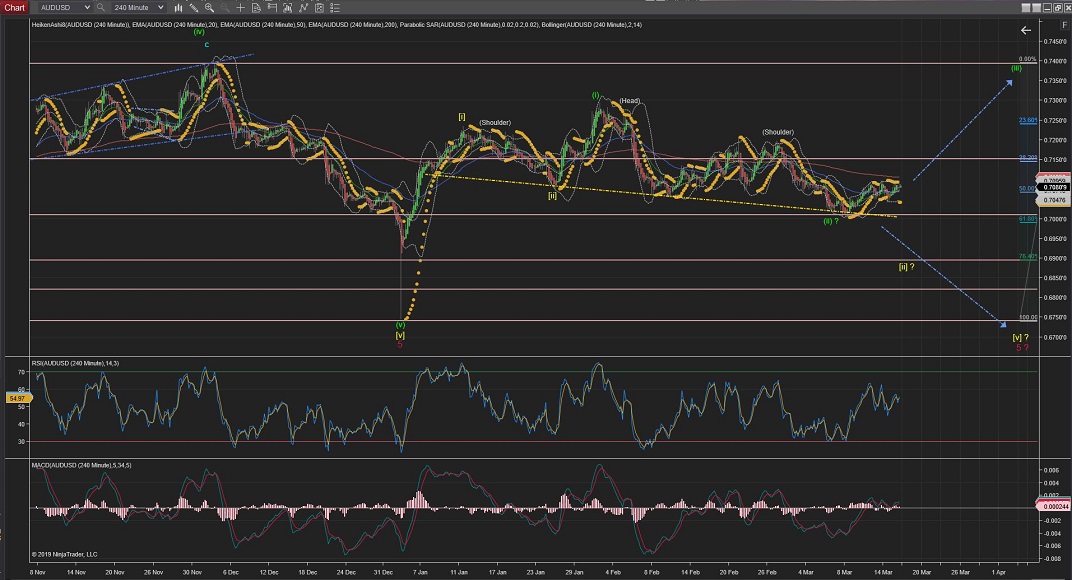
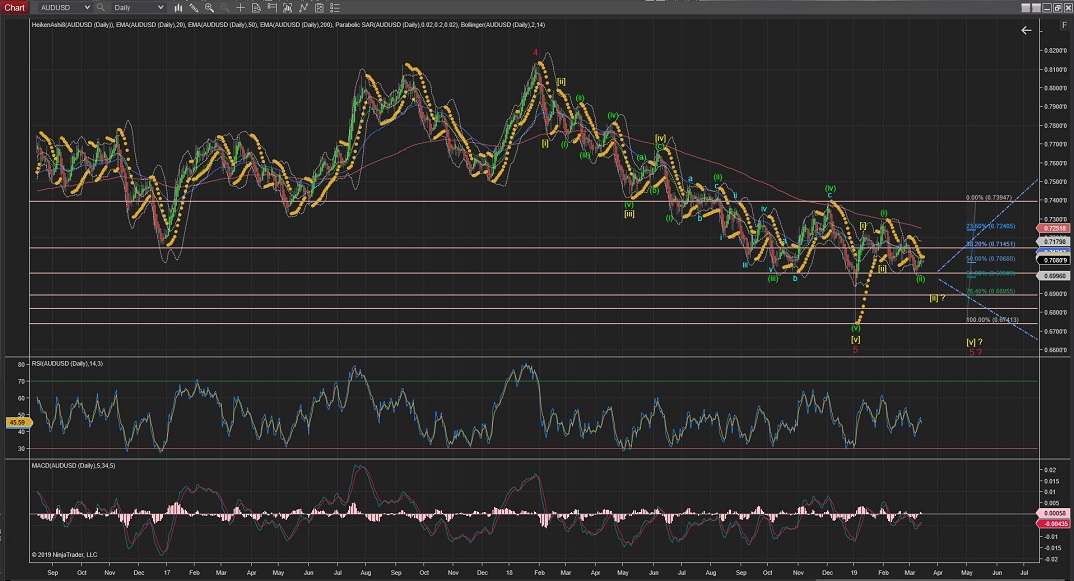
Daily & 4Hour Charts:
AUDUSD 4Hour Chart is showing the price raising from the neckline of a clear Head & Shoulders pattern which is suggesting Wave (iii) could be finally making its way up.
Still not out of the woods yet, so further moves lower than this neckline would trigger the alternative count for an extended Wave [ii] going towards the %76 levels of support, although it is still possible an extended Wave [v] or even a further extended Wave 5, with not much resistance levels to stop the move down (best seen in the 4Hour and Daily charts) .
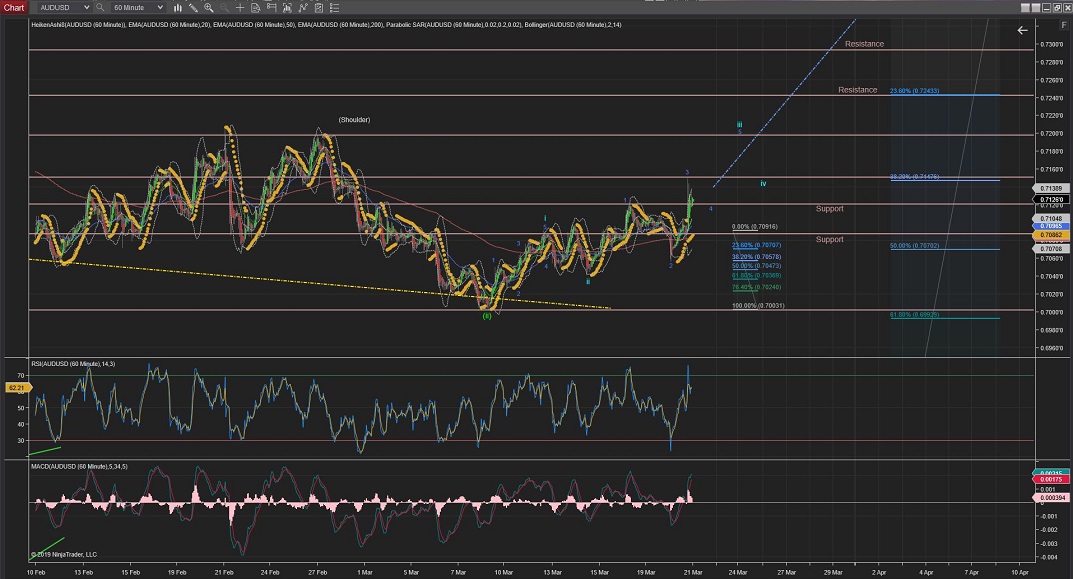
Hourly Chart:
The 60Min chart shows to have completed an internal 5 wave structure for the first Wave i up.
Completed a correction for Wave ii between the %50 and %62 Fib retracement.
And now has completed a further Wave 1, Wave 2 and Wave 3 (blue) for Wave iii with a target at the 0.7200 Resistance above.
Once Wave iii is completed we should see a Wave iv correction take place towards supports above previous lower degree Wave 4(blue).
60Mins
4Hours
Daily
Weekly
All the best for everyone.
Andres


 Trading Waves .org