Wed 06-03-2019
Hi everyone, hope you are all ok.
USDJPY
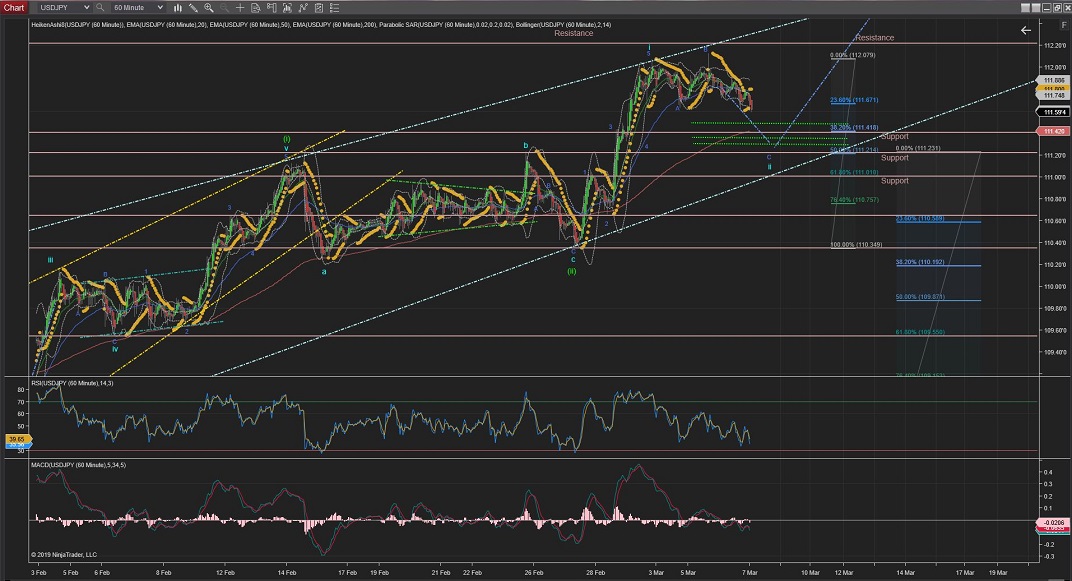
USDJPY is still going through Wave c of Wave ii correction towards support at the %50 Fib retracement levels (111.20); Should not be long before its completion.
Given the length of Wave a areas of support at the %50Fib, it is very likely that the drop will find there the end of the correction and prices should start moving up impulsively again on Wave iii of Wave (iii).
60Mins
4Hours
Daily
Weekly
USDCAD
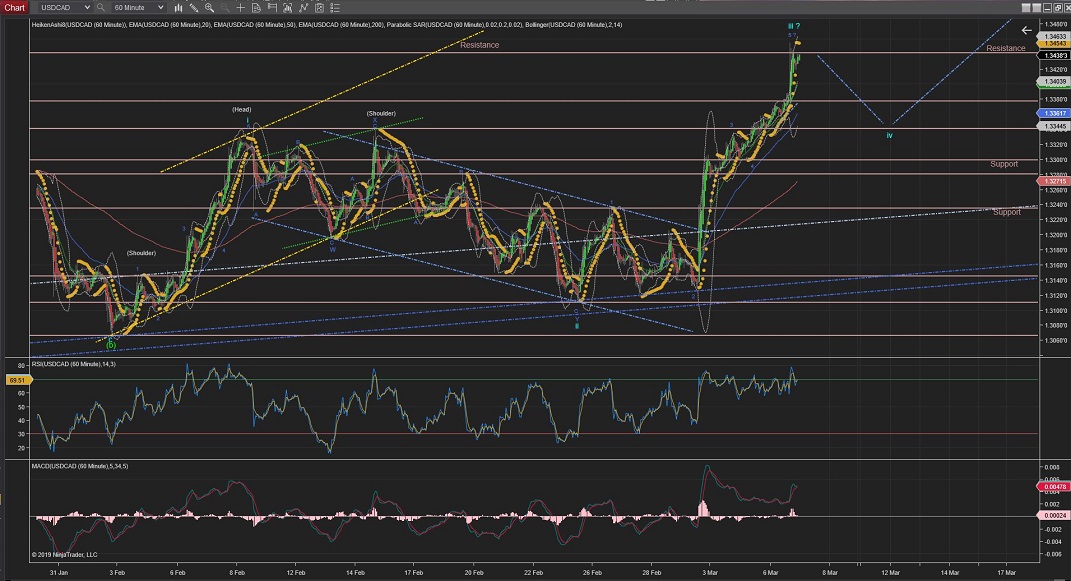
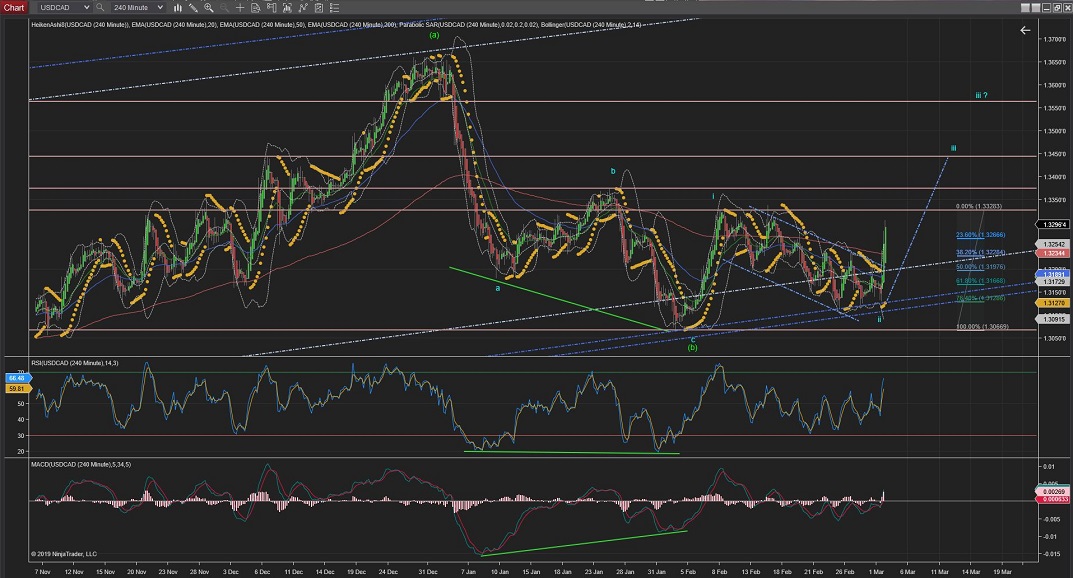
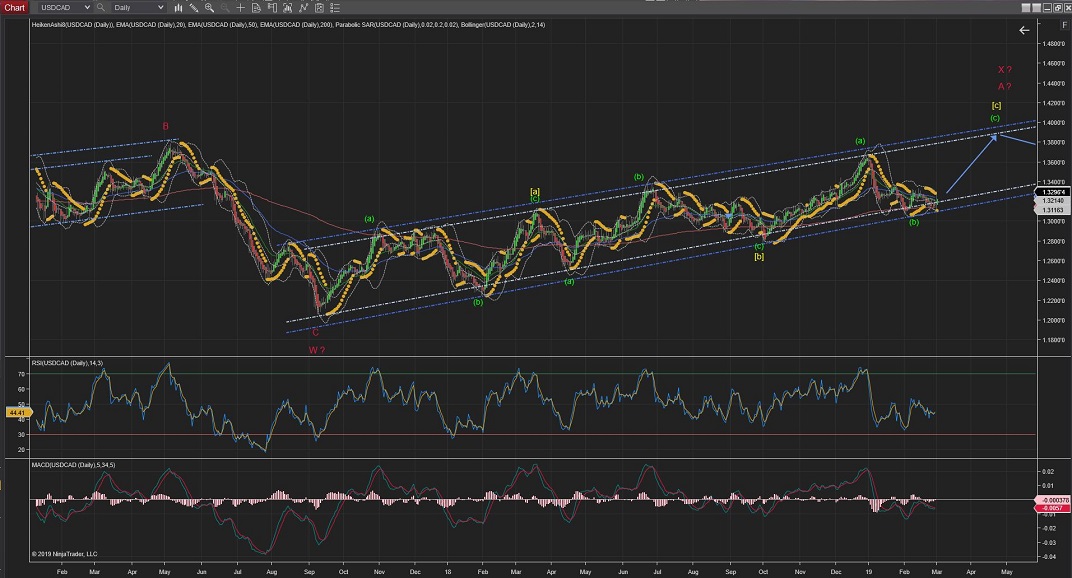
USDCAD Wave iii keeps raising and it has now hit the resistance at 1.3440.
If this resistance is broken, the next level of Resistance would be at 1.3560 area
After Wave ii completion, the next move I would expect is Wave iv and the correction could go back to previous degre 4th Wave (Wave 4 in Royal Blue) but the support created by the highest of Wave 1 at 1.3233 should remain uncrossed.
60Mins
4Hours
Daily
USDCHF
Wave i might have completed before it reached resistance levels at 1.0060 as the price is moving sideways now.
I would expect a Wave ii correction to go lower now towards the %50Fib Support area before prices carry on raising again on Wave iii.
(Wave ii correction has a range of levels of resistance between the %38 and %50 Fib levels).
60Mins
4Hours
Daily
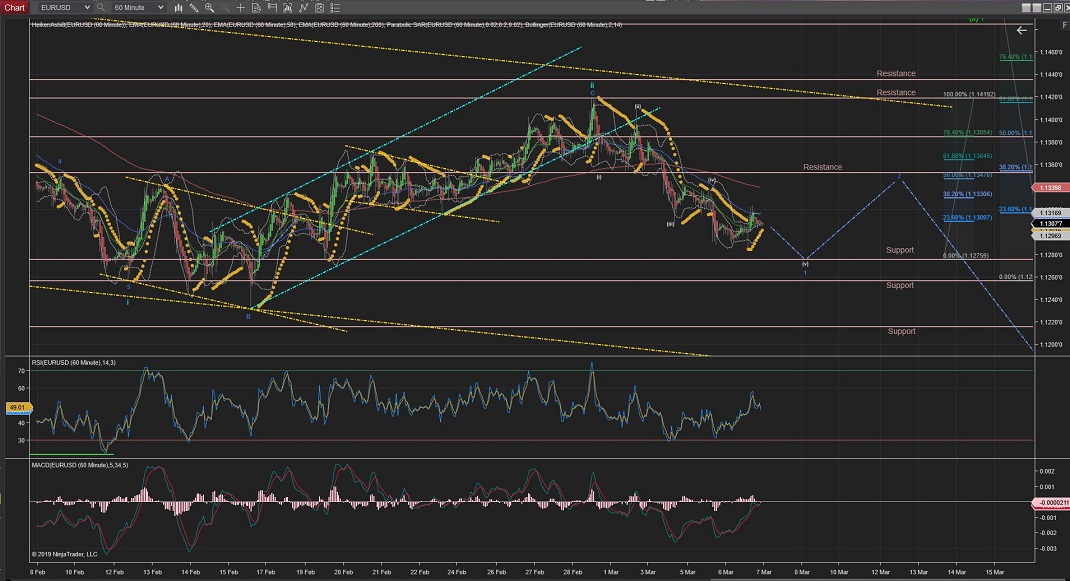
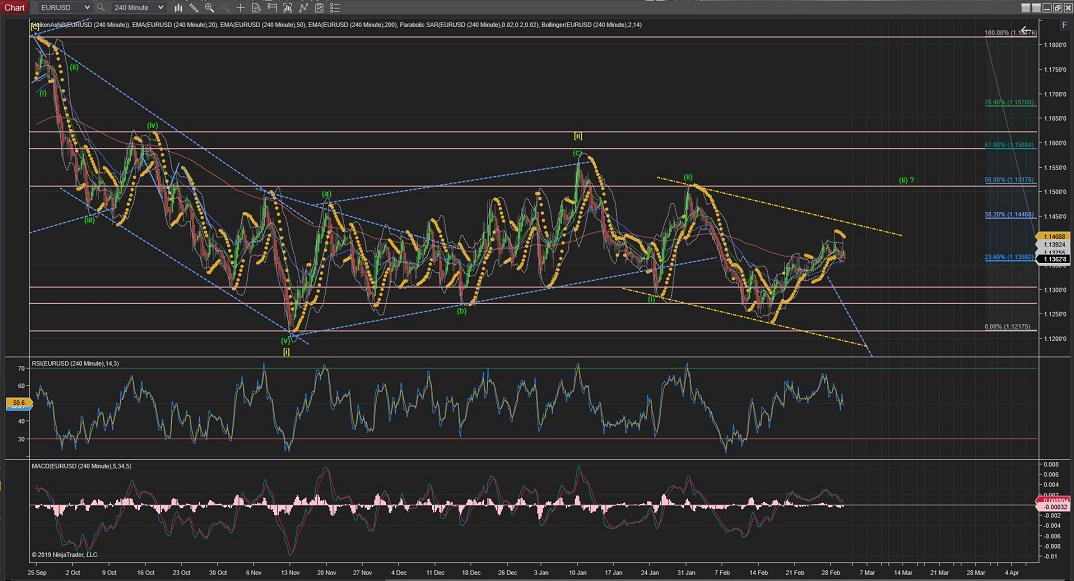
EURUSD
EURUSD has continued the moves to the downside slowly and it is still going through Wave 5 to complete the first Wave of Wave (iii).
I would expect prices to continue down towards the next levels of support between 1.1280 and 1.1260 area.
From there Wave 2 should do a correction back towards the Resistance made by previous Wave iv or the resistance made at 1.1352 area.
60Mins
4Hours
Daily
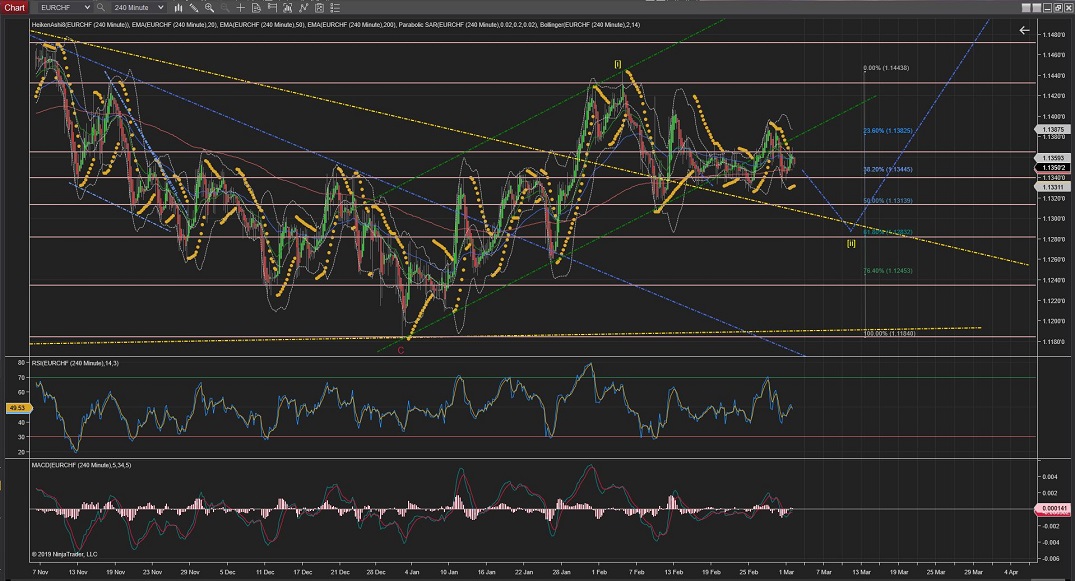
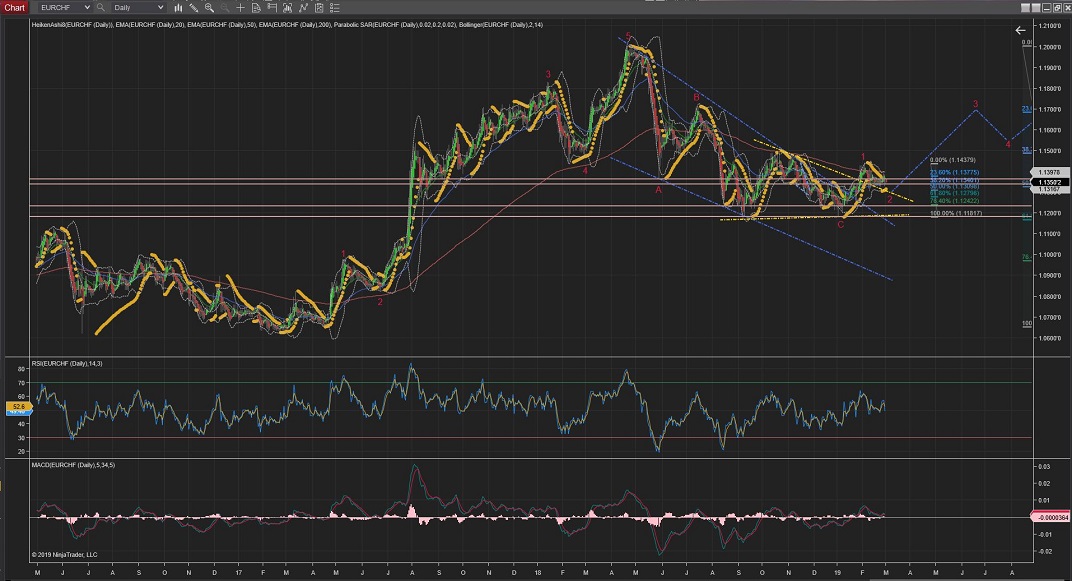
EURCHF
EURCHF has made a move up on what appears to be a Wave i up, although not very impulsive.
For this count to remain valid I would like to see what now should be the corrective Wave ii to be completed between the %50 and the %76 and from there the price to raise with impulsive waves.
Wave iii would be confirmed once it crosses the highest of Wave i (at 1.1367).
60Mins
4Hours
Daily
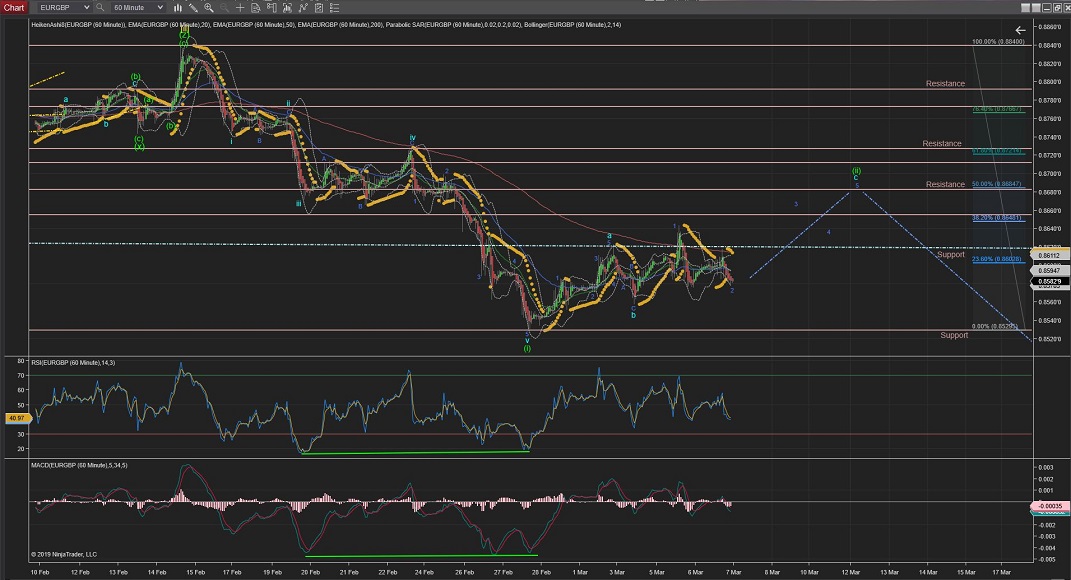
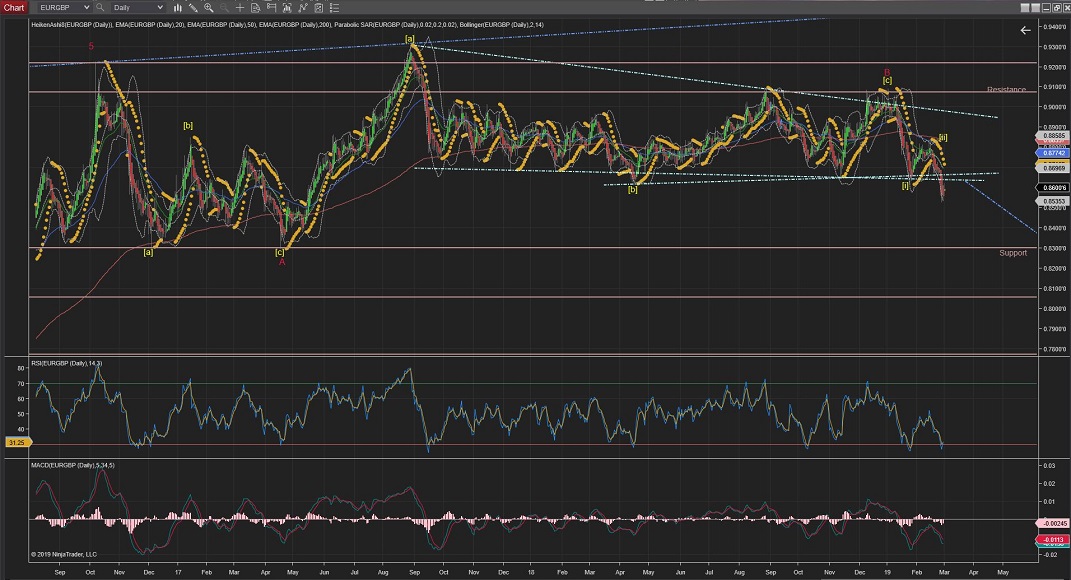
EURGBP
EURGBP has completed a 5-Wave structure for Wave a of Wave (ii).
Then completed a 3-Wave structure for Wave b.
And it is now still on Wave 2 of Wave c for Wave (ii) ZigZag correction (5,3,5).
With the target at the %50 Fib retracement of Wave (i) (0.8684 price area).
Prices should start dropping impulsively again from there.
60Mins
4Hours
Daily
Weekly
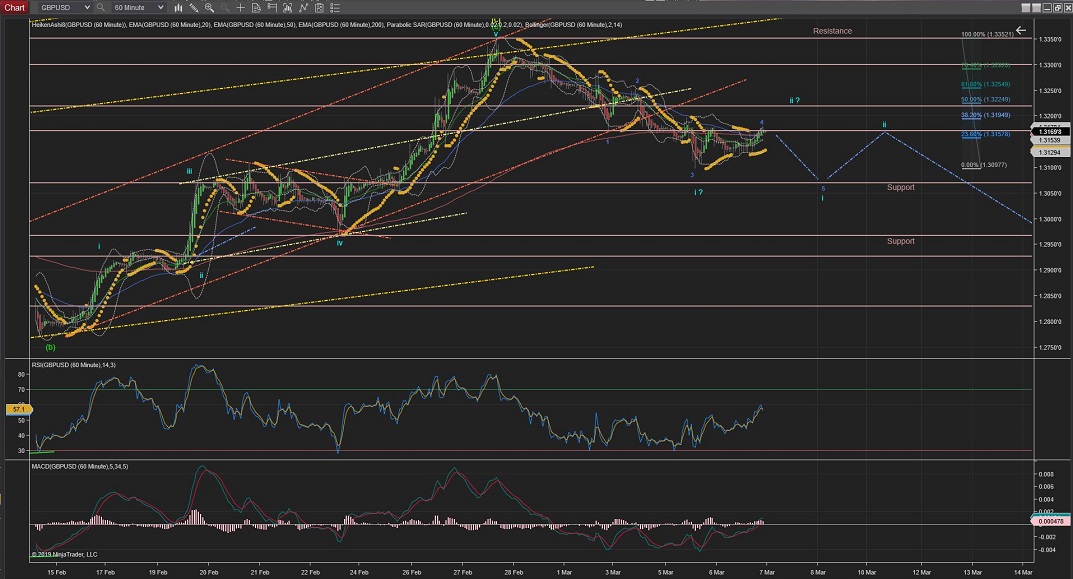
GBPUSD
GBPUSD is not far from completing Wave i (of Wave (i)). And it could complete this first wave at the level of support created by the highest of the previous Wave iv (at 1.3069).
Any further move up would invalidate the current short-term count and would suggest that Wave ii is already on the way instead.
In any case, once completed Wave ii, I would expect Wave ii to play the correction before prices carry on dropping again.
60Mins
4Hours
Daily
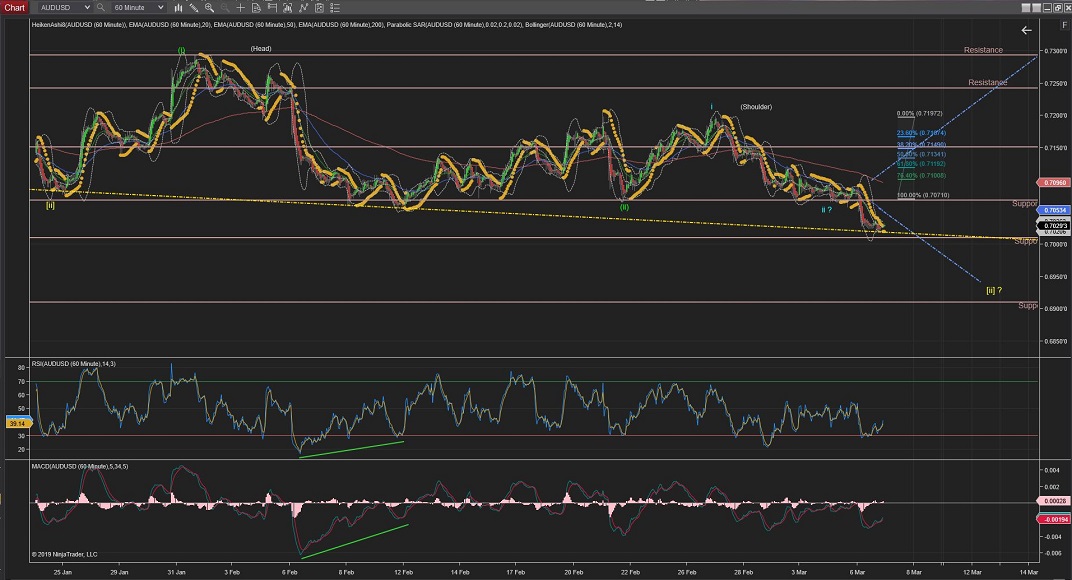
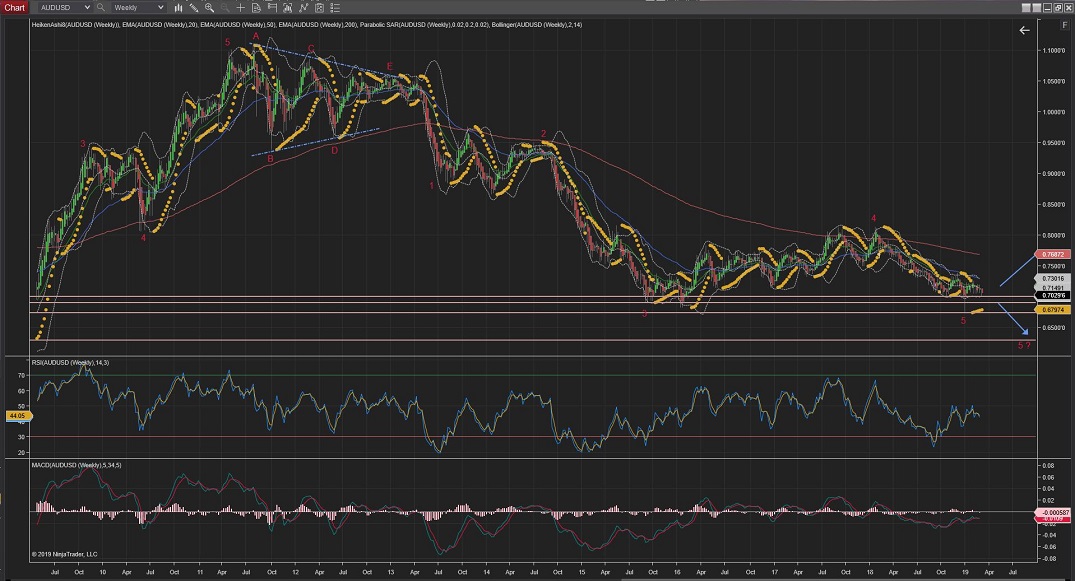
AUDUSD
AUDUSD today has played further moves to the downside which have triggered an alternative count for an extended Wave [ii] but could also trigger a continuation of Wave 5 (red), as can be seen in the Weekly Chart.
The 4Hour Chart is showing the price at the neckline of a clear Head & Shoulders pattern which should be about to pop anytime now.
Further moves lower than this neckline would trigger the alternative count for an extended Wave (v), although it is still possible an extended Wave [ii] going towards the %50, %62 or %76 levels of support with not much resistance levels to stop the move down (best seen in the daily chart) .
60Mins
4Hours
Daily
Weekly
All the best for everyone.
Andres


 Trading Waves .org