Tue 26-02-2019
Hi everyone, hope you are all ok.
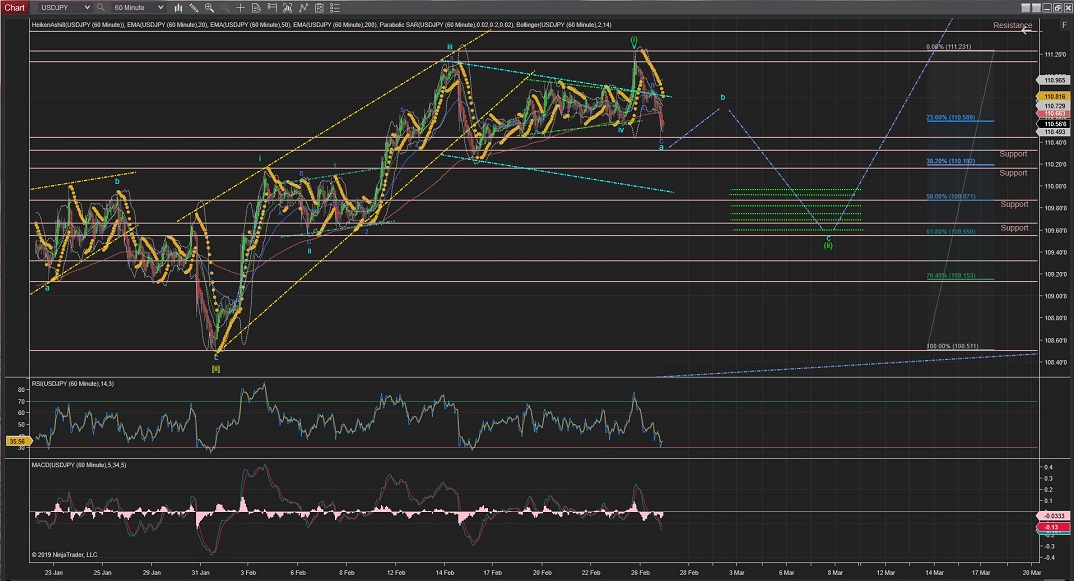
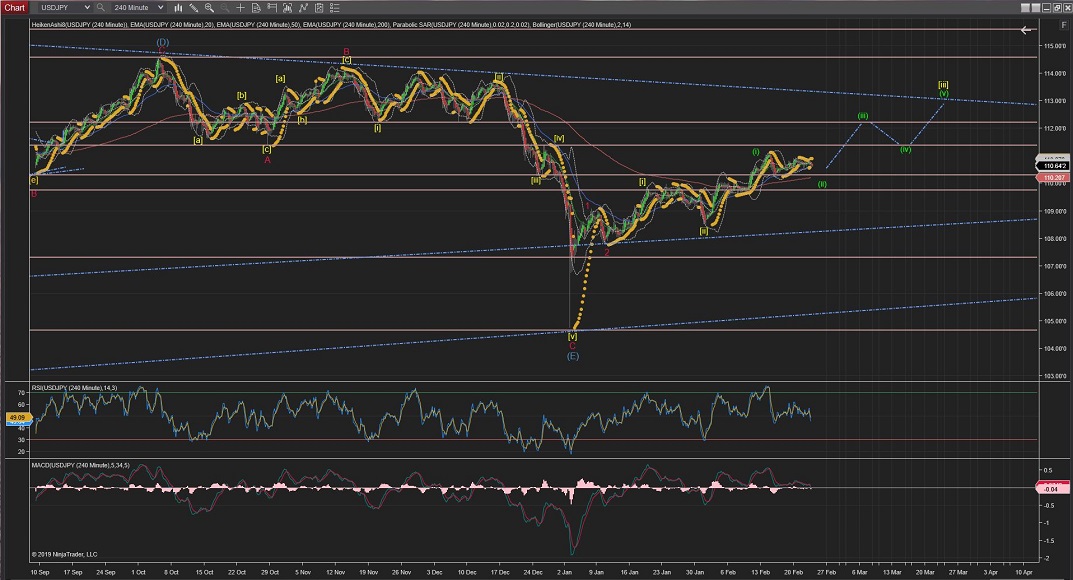
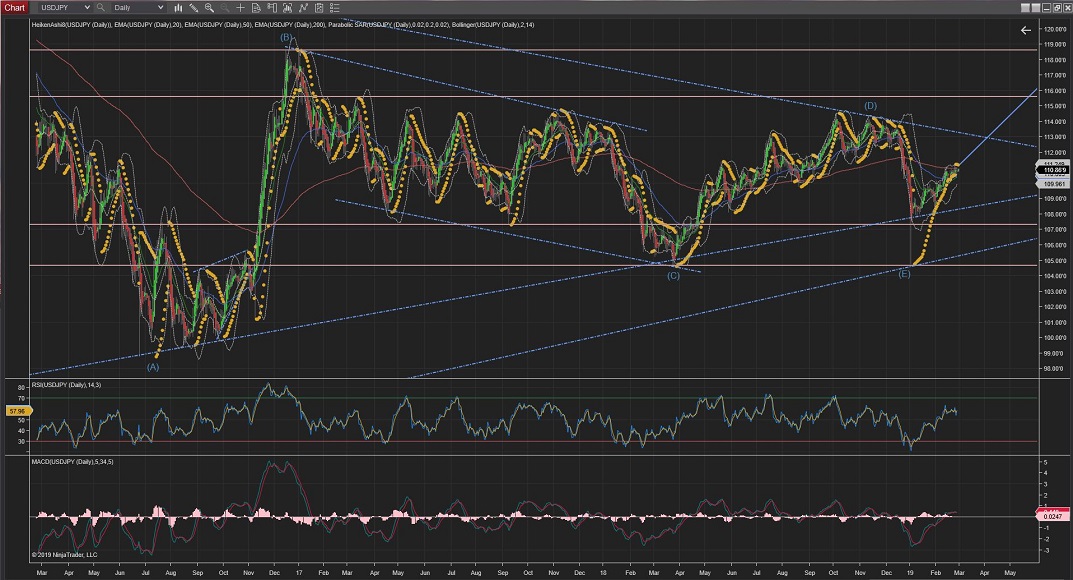
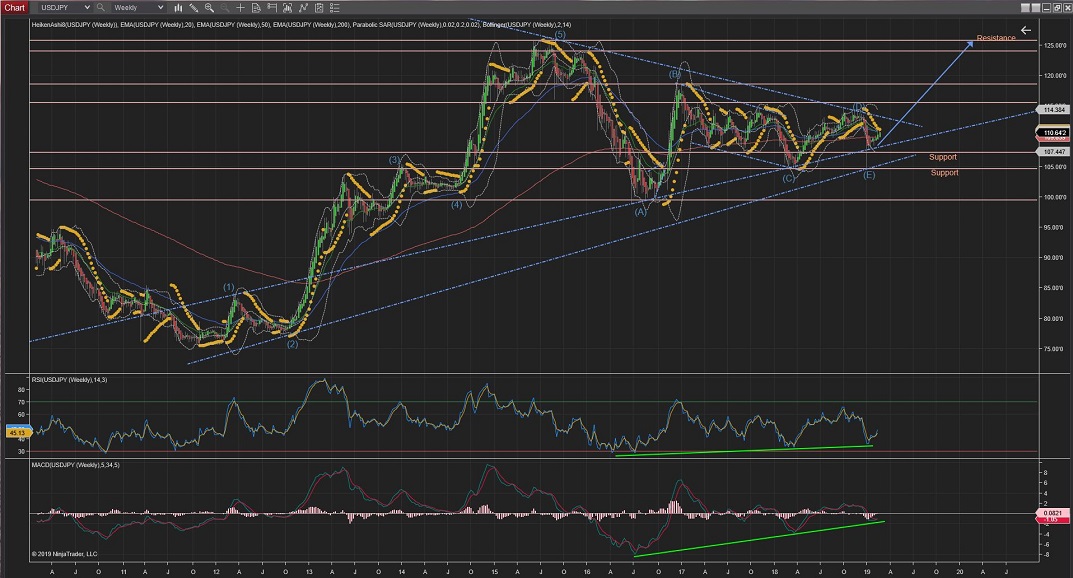
USDJPY
USDJPY has now completed Wave a of Wave (ii) with three waves, suggesting a 3,3,5 Flat correction.
Now is time for Wave b and I would expect Wave c to complete Wave (ii) between the %50 and %62 Fib retracement area.
60Mins
4Hours
Daily
Weekly
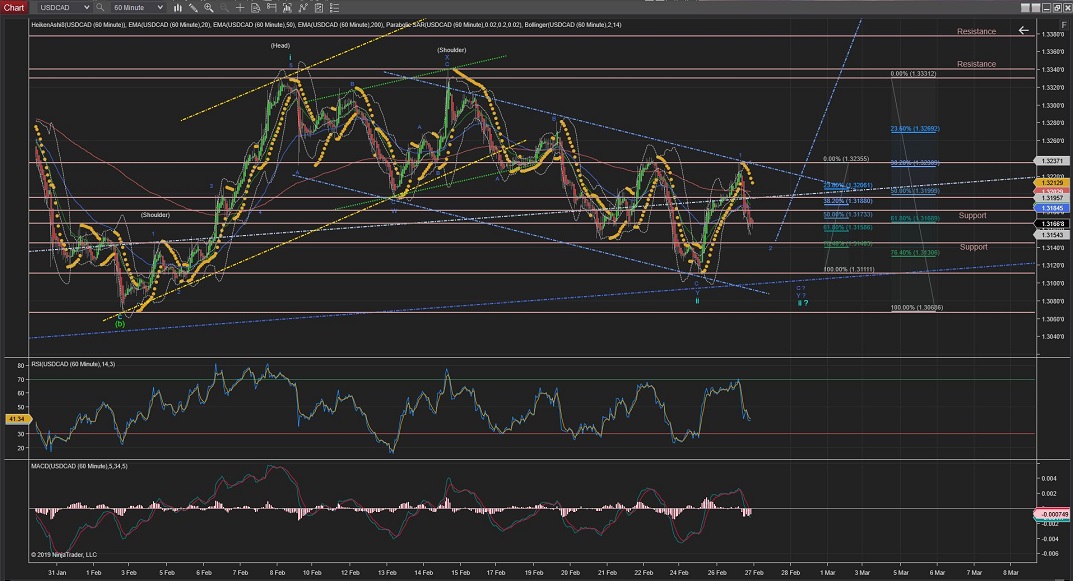
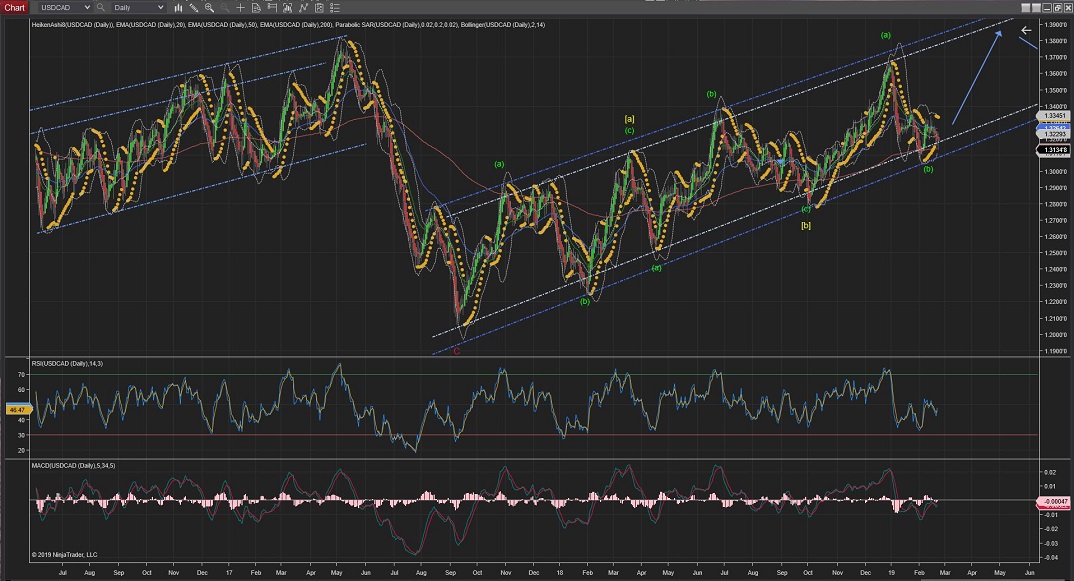
USDCAD
USDCAD is now going through Wave 2 correction and has stalled just above the %62 Fib retracement.
As previous Waves 1 & 2 (blue), I would expect the current Wave 2 correction to retrace no more than %76 and the impulsive waves to carry on up from there for Wave 3 of Wave i, otherwise it would suggest another try at touching the lower long-term trend and extend Wave ii slightly further down.
60Mins
4Hours
Daily
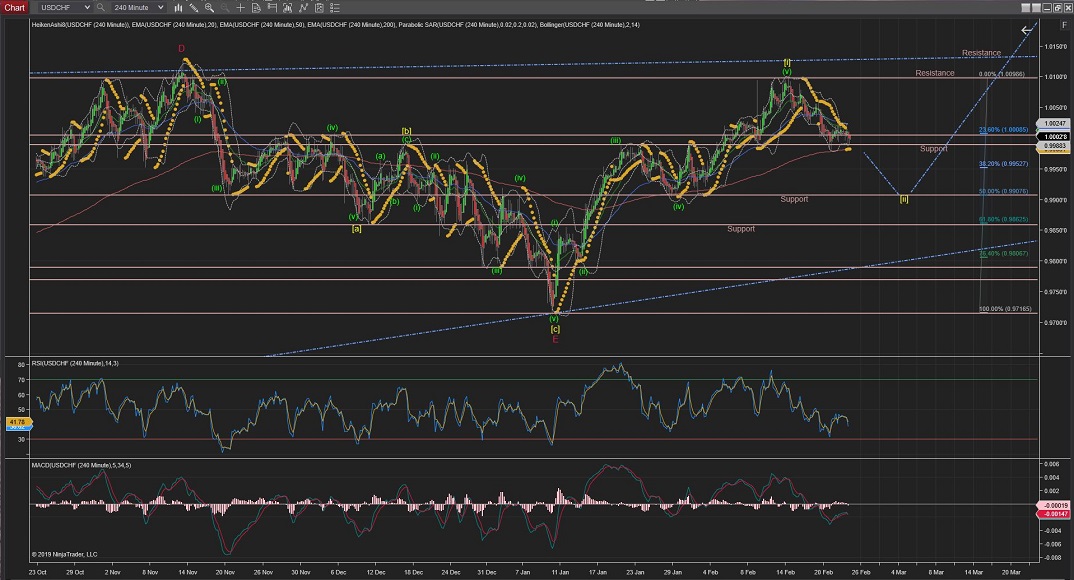
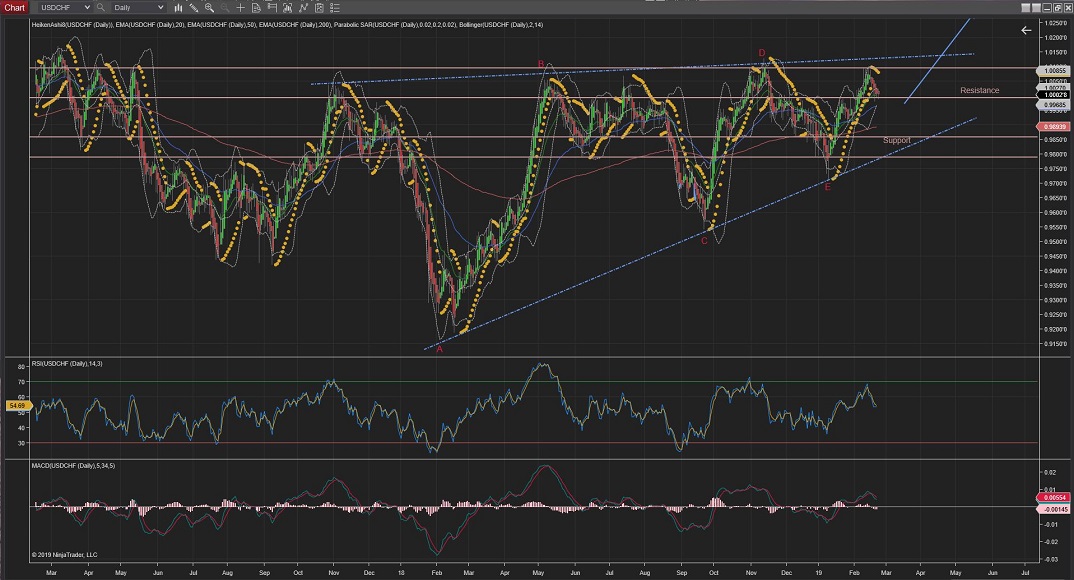
USDCHF
USDCHF is stack within a trend but continuing the ZigZag correction (5,3,5) on Wave [ii] on its Wave b and should start Wave c to the downside soon to complete Wave [ii].
From there, there are good levels of support for it to be completed around the %50 Fib Retracement of Wave [i], will start raising on impulsive waves for the start of Wave [iii].
60Mins
4Hours
Daily
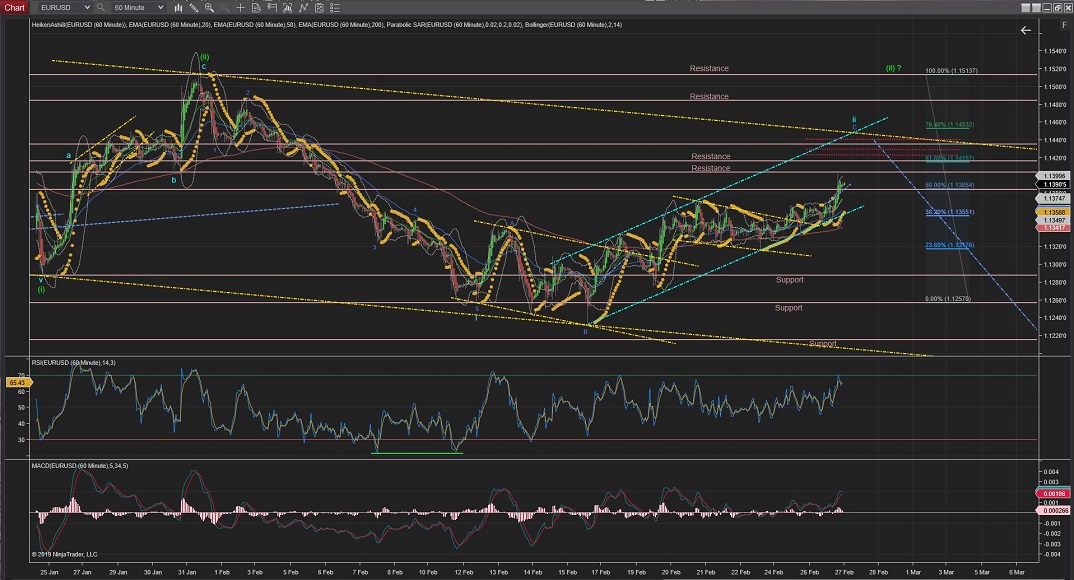
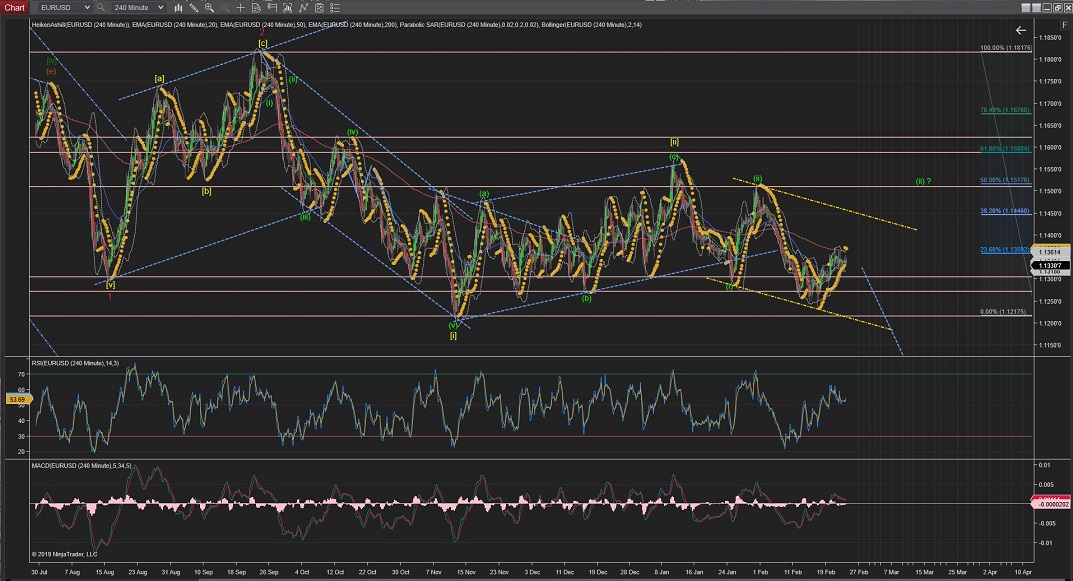
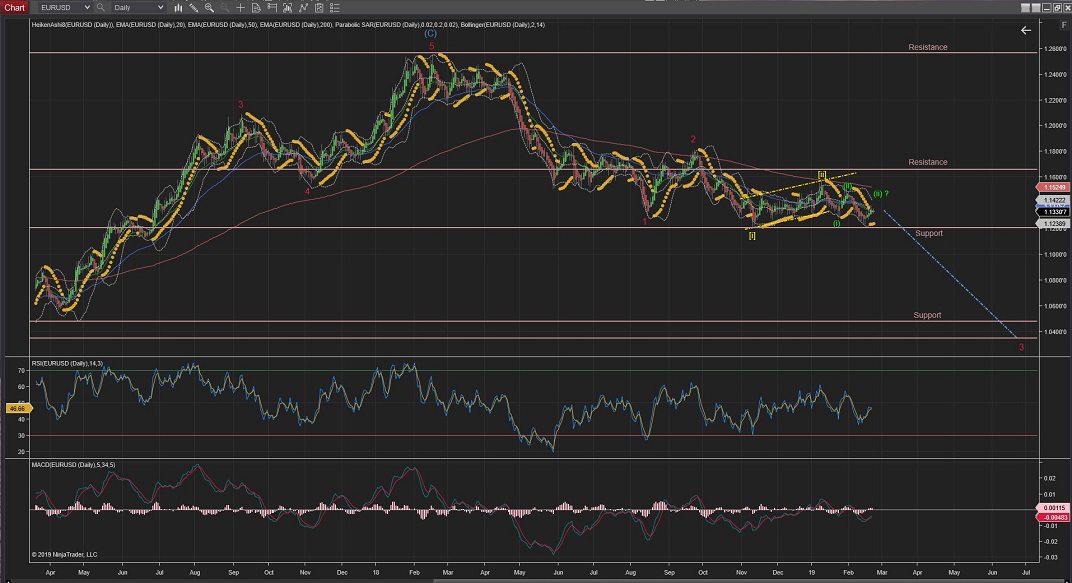
EURUSD
EURUSD has stalled just above the %50 Fib retracement on Wave C of Wave ii which is pointing to stop between the %62 and the %76 Fib as it will find there a parallel trend level and series of resistance levels that could start Wave iii down again.
(further moves up from this %76 Fib retracement would suggest a larger Wave (ii) and a break from the 0 Fib retracement would confirm such alternative count).
From Wave ii completion we should start seeing impulsive waves to the downside to start and follow Wave iii of Wave (iii) during the week.
60Mins
4Hours
Daily
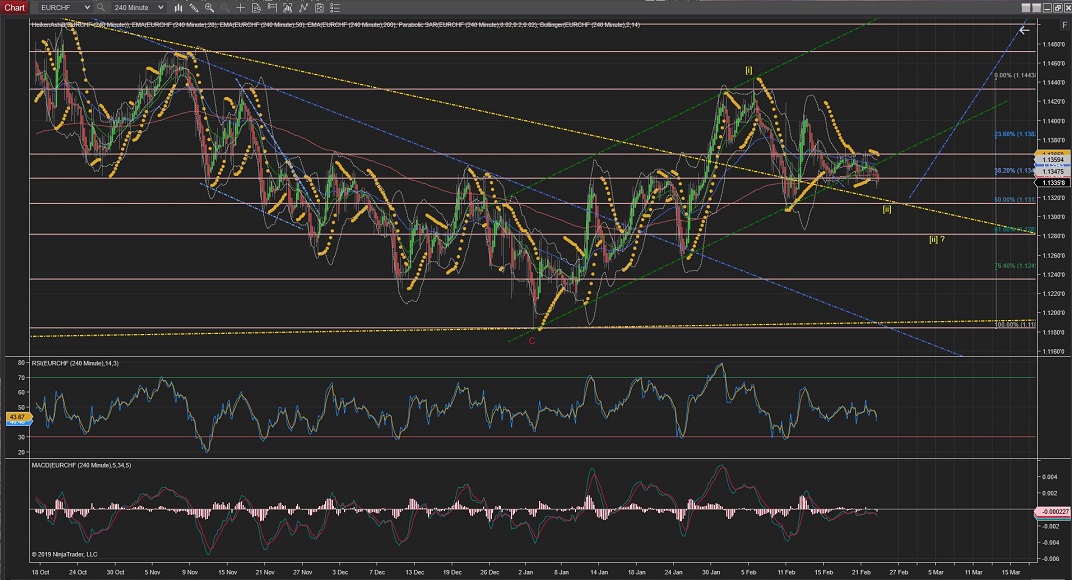
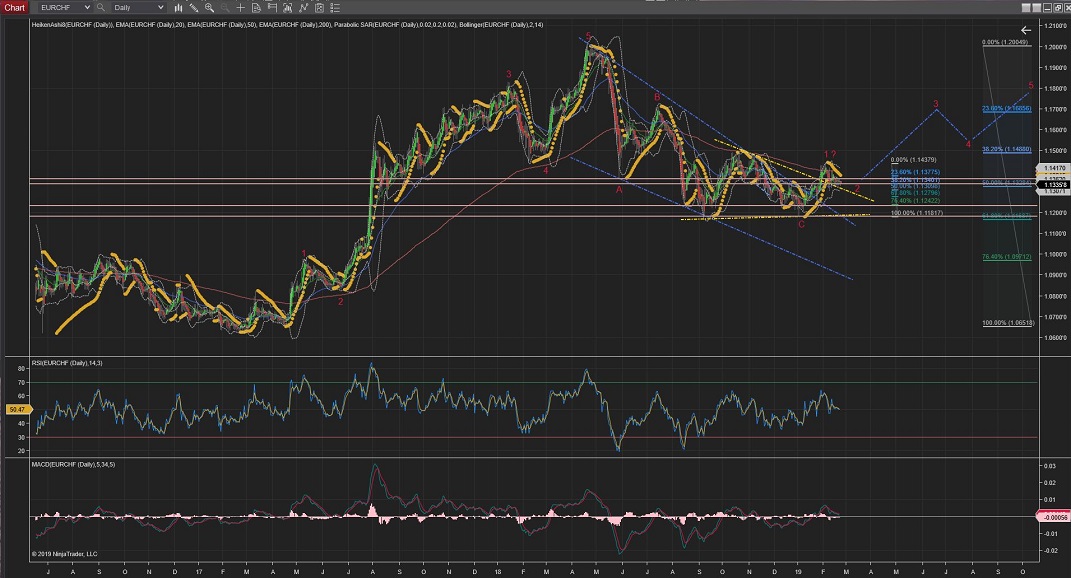
EURCHF
EURCHF rallied up completing Wave ii correction in less than %50 correction and Wave ii has already crossed the first level of resistance and heading now towards the next resistance made by previous Wave (b) at 1.1406.
I would expect Wave iv to start correction at that point and Wave v to continue the impulsive waves further up afterwards.
60Mins
4Hours
Daily
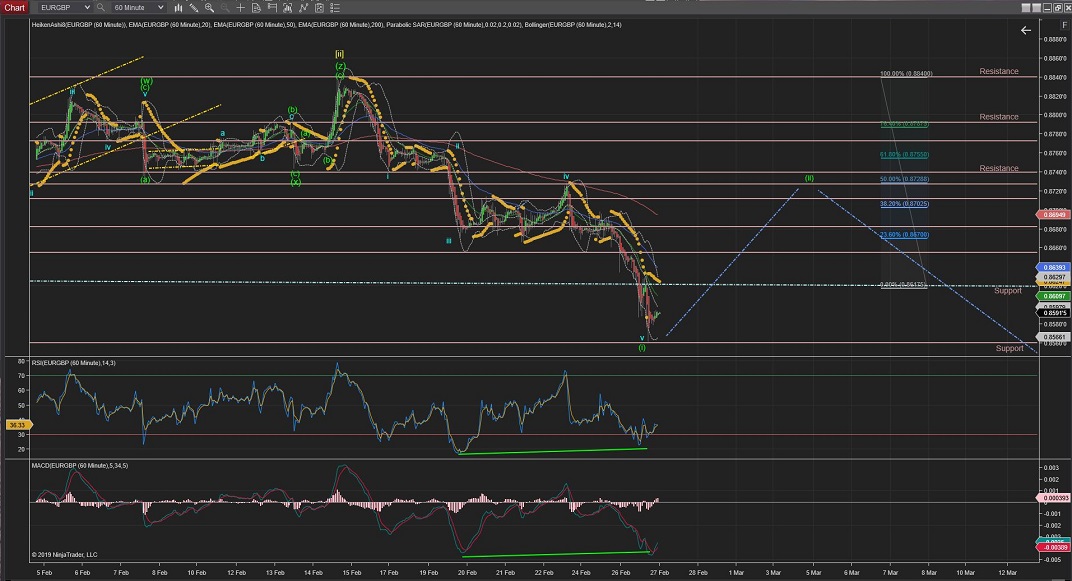
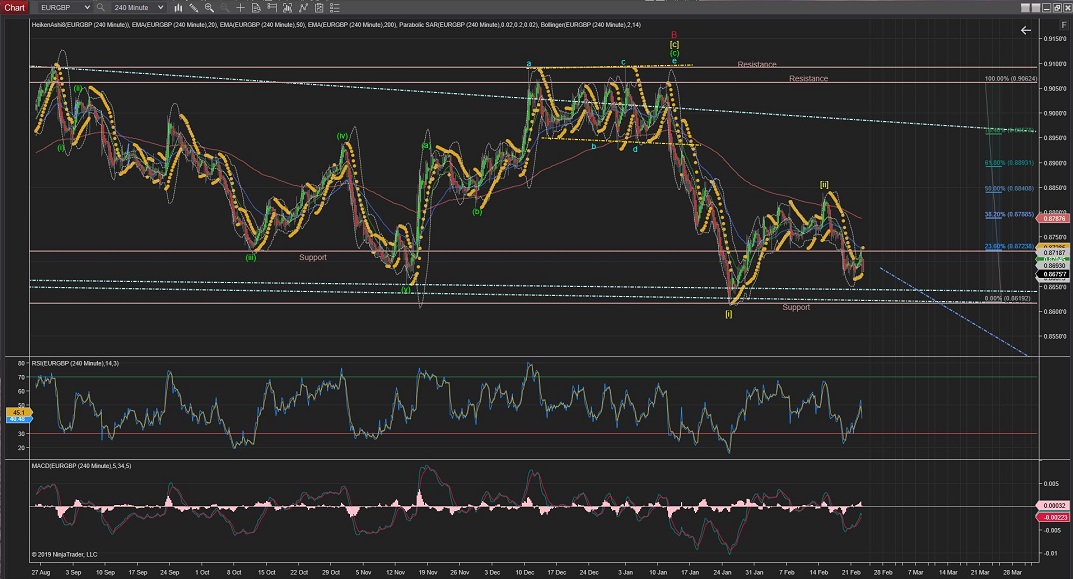
EURGBP
EURGBP has dropped below the lower long-term trendline with an extended Wave v which seems to have now completed Wave (i) and Wave (ii) correction should start making its way up towards Fib retracement and resistance levels.
The RSI and MACD indicators are pointing out a divergence which suggest an impulsive move up shortly.
60Mins
4Hours
Daily
Weekly
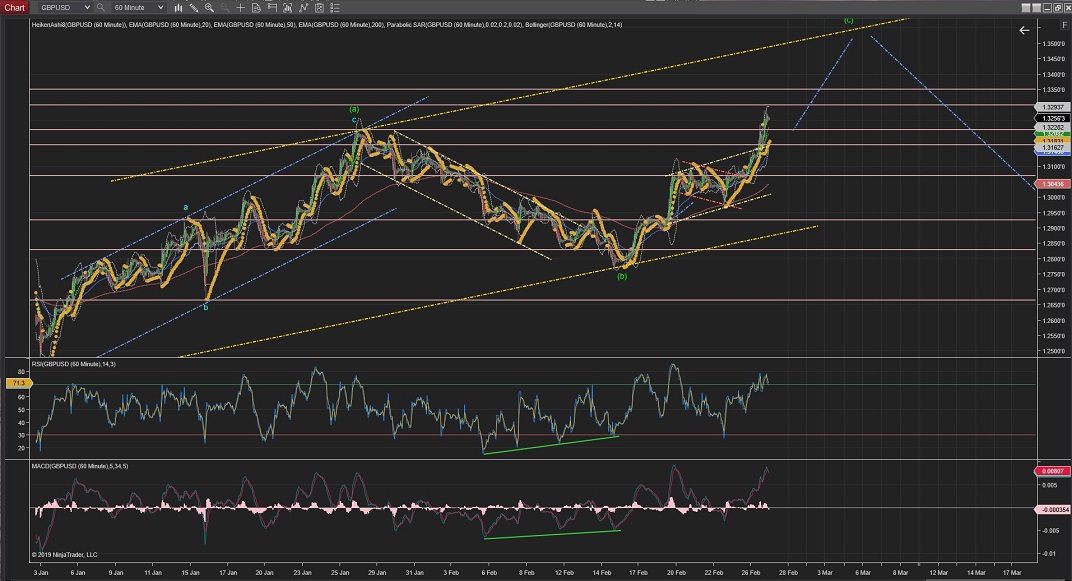
GBPUSD
GBPUSD has triggered an alternate count where Wave 2 (red) is still in play and price should be going towards the 1.3500 area for a %50 retracement of Wave 1 (red).
Best pictured in the Daily and 4Hour Charts.
60Mins
4Hours
Daily
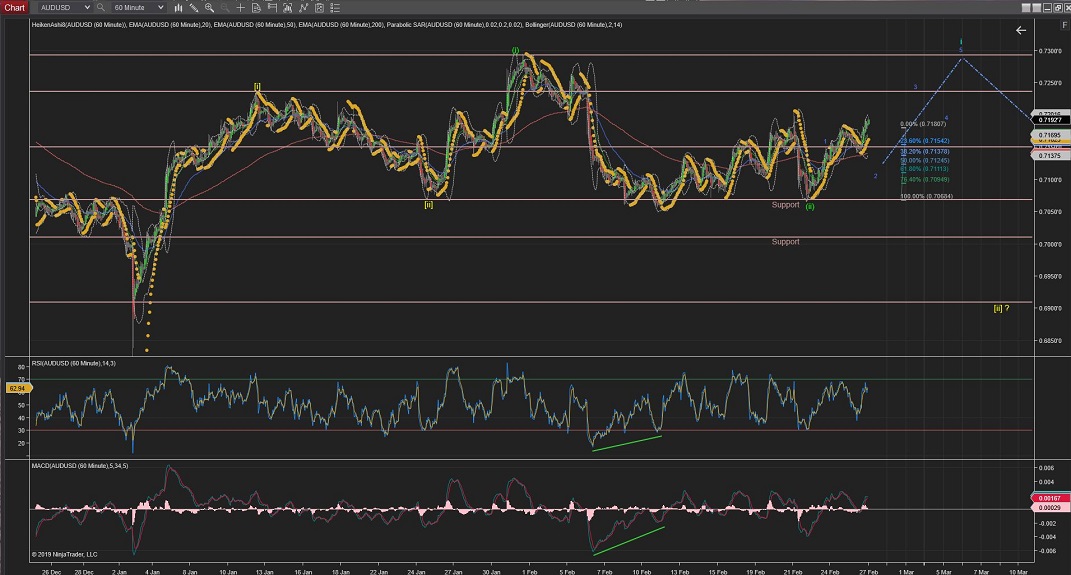
AUDUSD
AUDUSD; the current move after extended Wave (ii) completion seem to be picking up to the upside on Wave 3 of Wave i going towards the first level of resistance made by previous Wave [i] at 0.7237.
From this resistance level I would expect Wave iv to take place for a correction before Wave v takes price up again and crosses that resistance.
60Mins
4Hours
Daily
Weekly
All the best for everyone.
Andres


 Trading Waves .org