Mon 11-02-2019
Hi everyone, hope you are all good and started the week well.
USDJPY
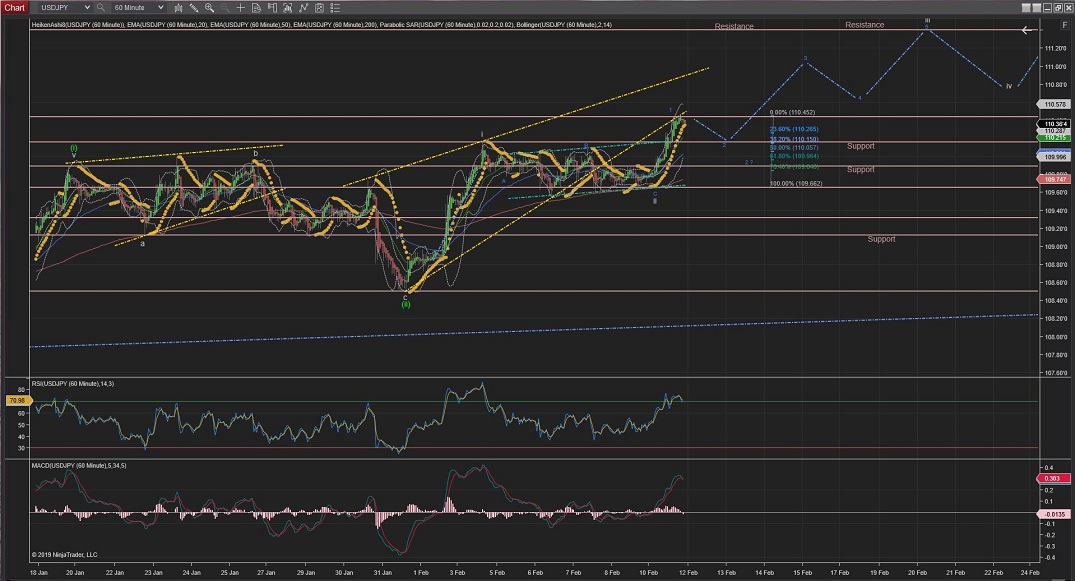
USDJPY jumped higher today confirming Wave iii is underway with Wave 1 (blue) complete and a correction with Wave 2 (blue) starting now.
The current Wave 2 of Wave iii might be completed at the %38 Fib retracement of Wave 1 as Wave i offers a strong support, although if this support is broken we can expect Wave 2 to complete around the %62 area.
Once Wave 2 is complete we should Wave iii continuing to raise higher towards resistance levels.
60Mins
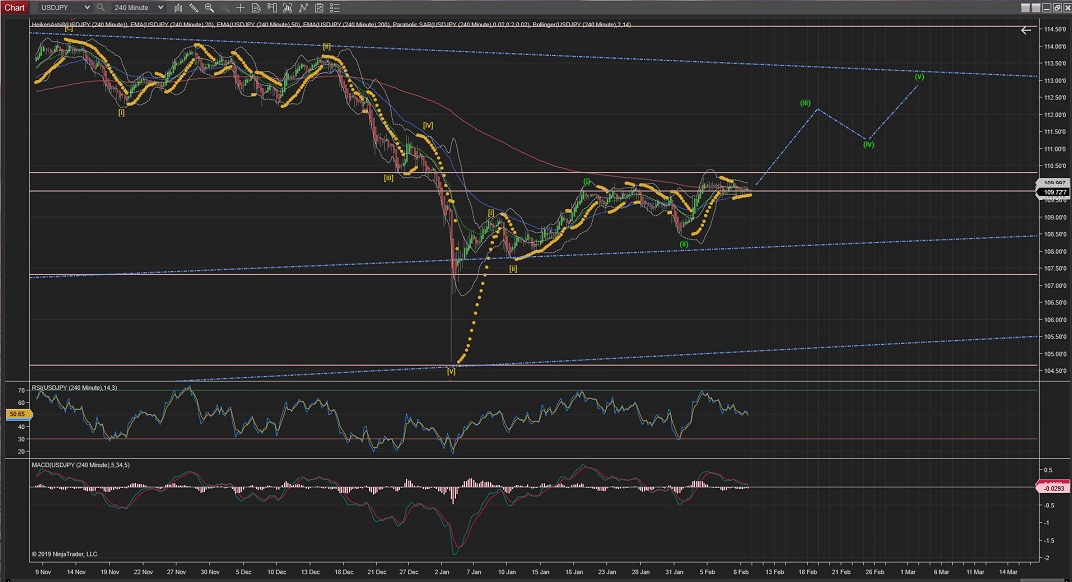
4Hours
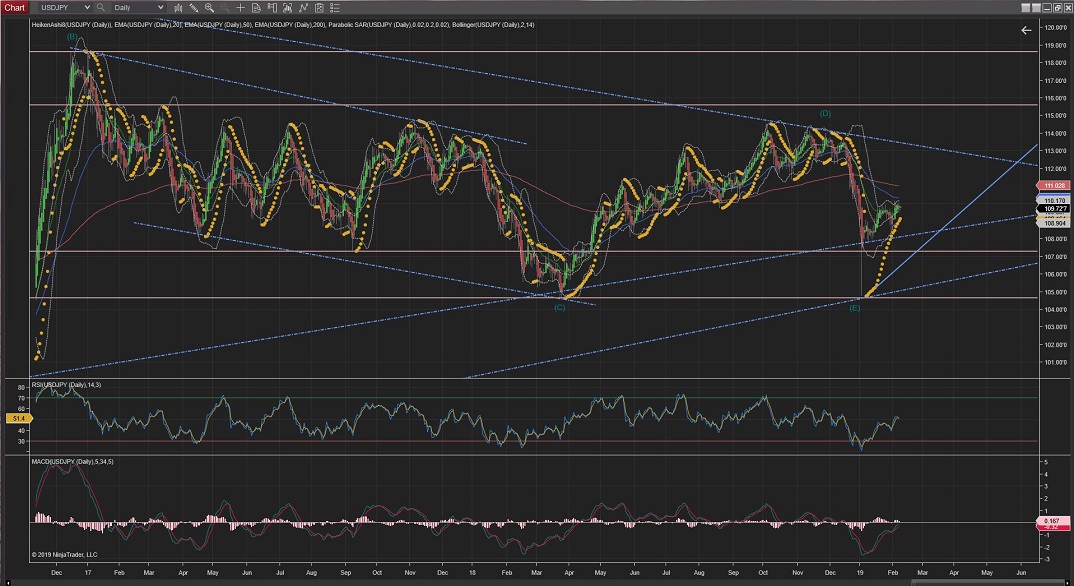
Daily
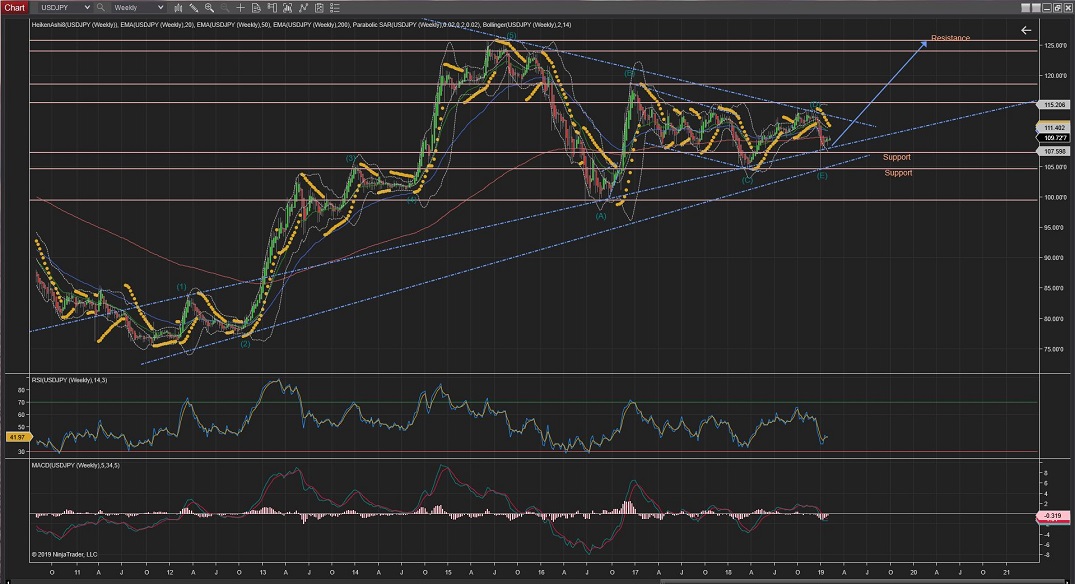
Weekly
USDCAD
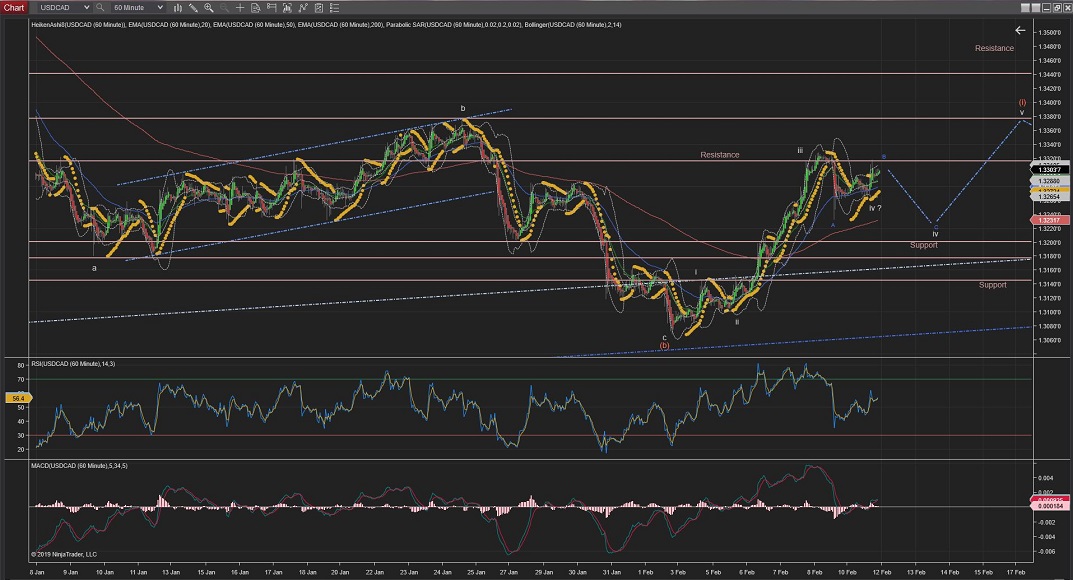
USDCAD is still going through Wave iv correction after Wave iii.
Wave iv seem to have already done the first of its corrective waves and might raise slightly before it drops again towards support (1.3200 area) for completion, although there is a real possibility that Wave iv has come to an end and Wave v might have already started.
60Mins
4Hours
Daily
USDCHF
USDCHF completed Wave ii and raised towards resistance on Wave iii, which should be continuing tomorrow.
The highest of Wave i (@1.0020) should serve as a strong level of support.
60Mins
4Hours
Daily
EURUSD
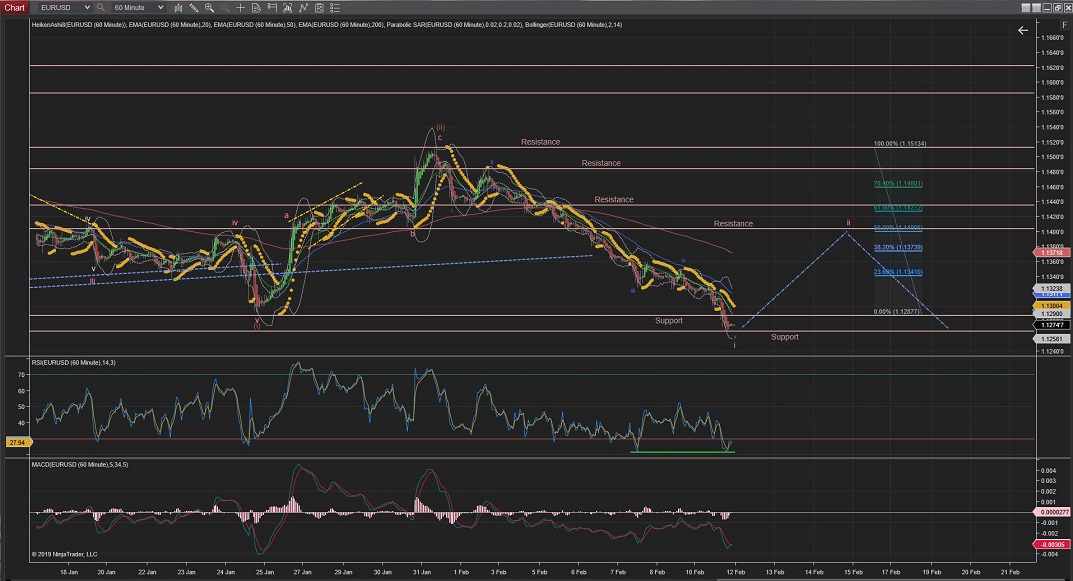
EURUSD broke the first levels of support made by Wave (i) and stopped at the next level of support suggesting a more bearish outlook.
Although the RSI is now showing a Divergence indication on the hourly chart, which indicates that Wave i is completed and Wave ii is about to start, probably towards the %50 Fib and Resistance levels.
60Mins
4Hours
Daily
EURCHF
EURCHF Wave [ii] has not hit the %76 retracement and it is still showing indications that might go lower towards the %76 support levels.
Once Wave [ii] is complete, if this count is correct, there should be impulsive moves up indicating Wave [iii] is underway.
60Mins
4Hours
Daily
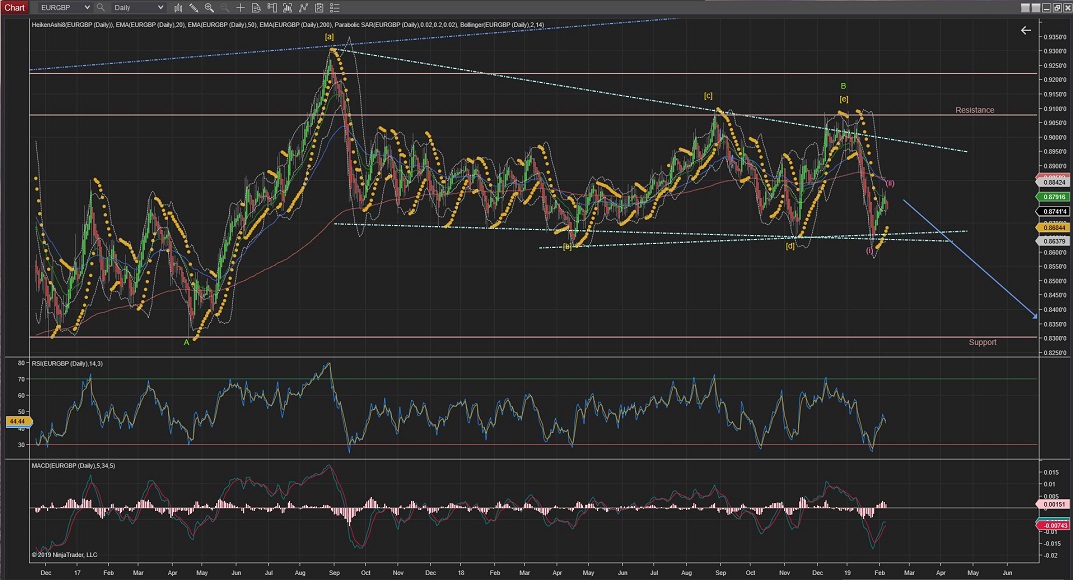
EURGBP
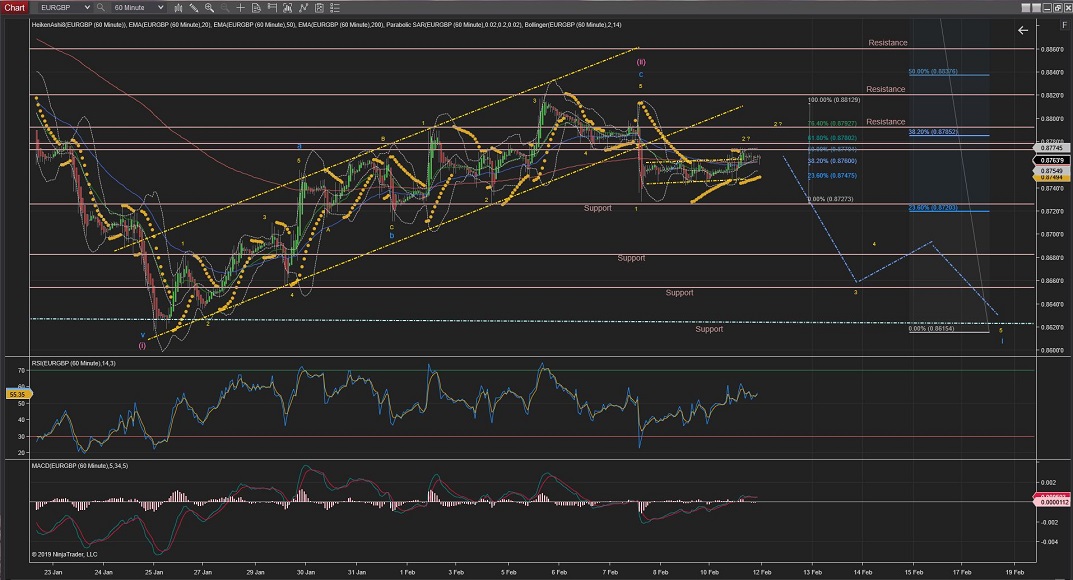
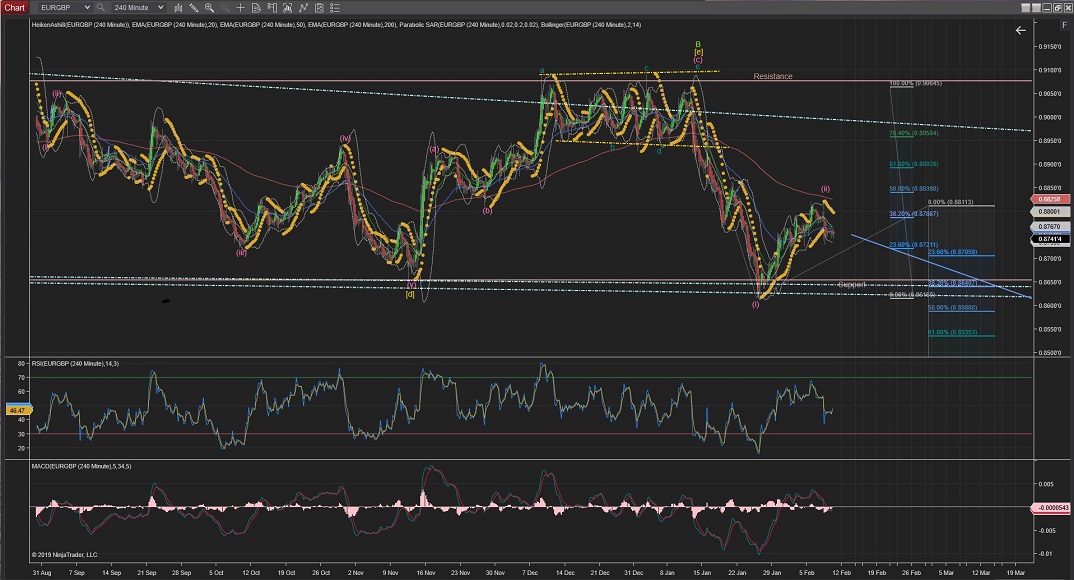
EURGBP is still stuck on Wave 2 (yellow) which could potentially end at the %76 fib retracement level, although once it is completed, seen previous impulsive moves to the down side, Wave 3 should show them too which should cross the initial Support levels towards the lower long-term trend line.
60Mins
4Hours
Daily
Weekly
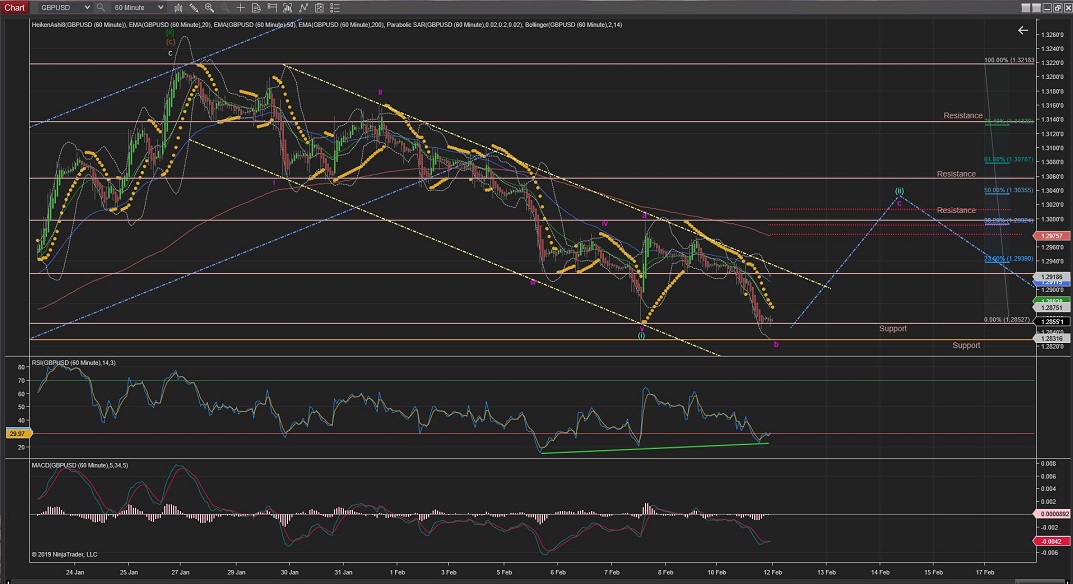
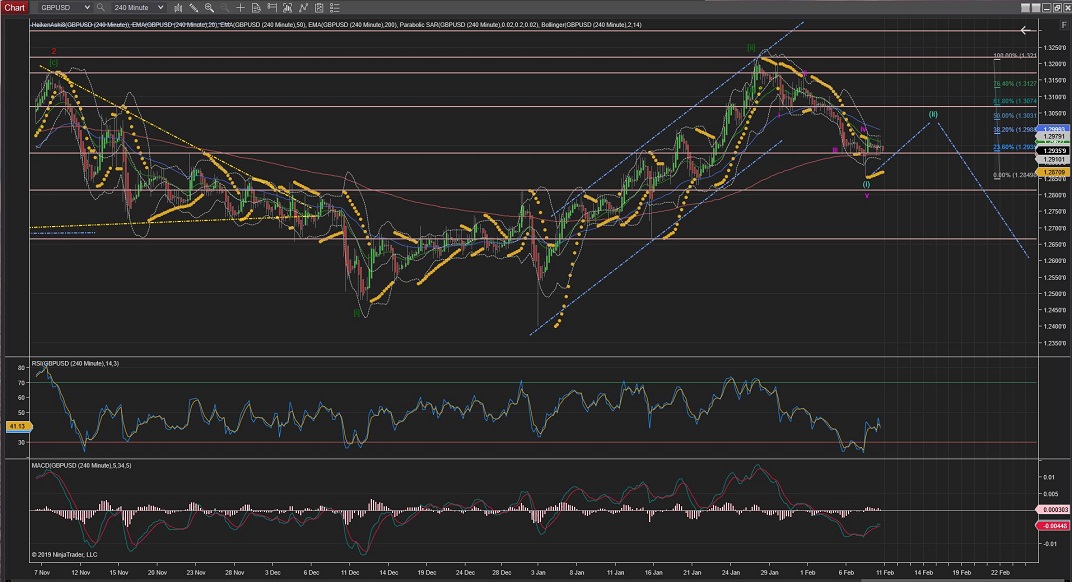
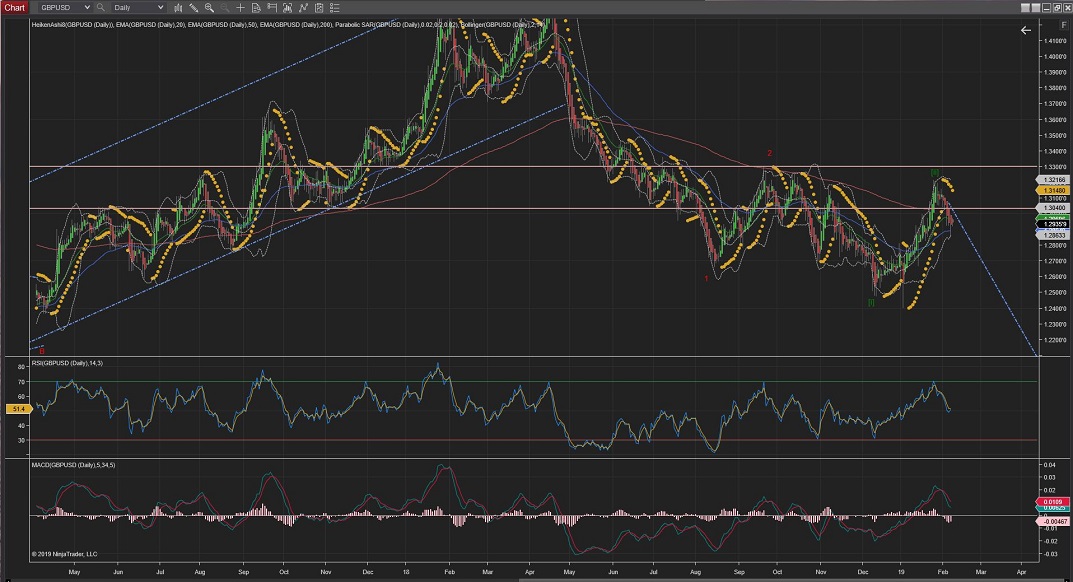
GBPUSD
GBPUSD is going through Wave (ii) in a Flat (3,3,5) pattern and Wave b seem to have come to an end soon, so we should see 5 waves up to complete Wave (ii) around the %38 or %50 Fib retracement levels.
(The divergence shown by the RSI adds weight to the indication that Wave c up should start soon).
Once Wave (ii) is completed, Wave (iii) of Wave [iii] should start impulsive moves downwards.
60Mins
4Hours
Daily
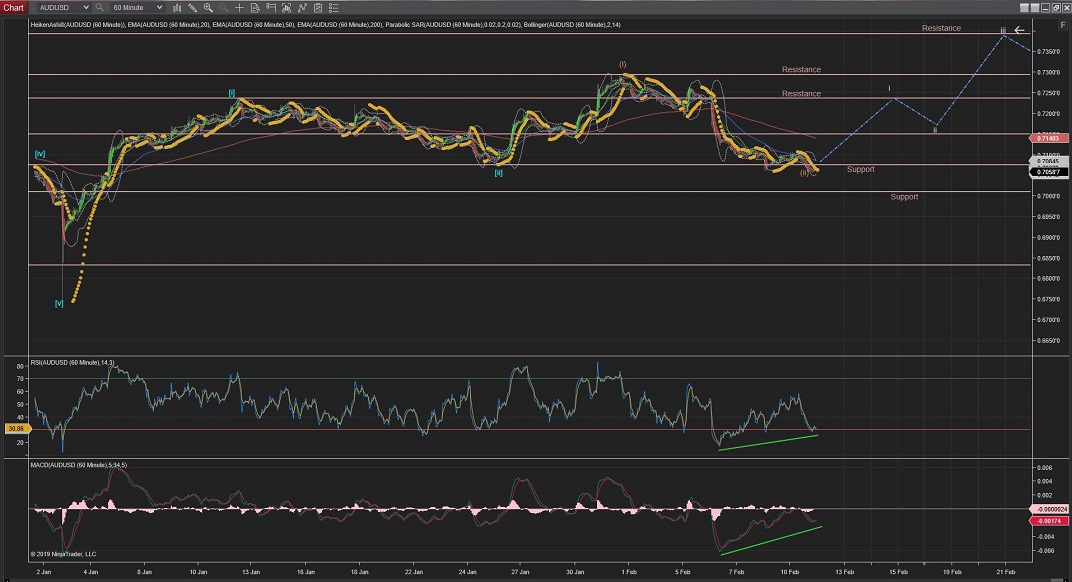
AUDUSD
AUDUSD has still not produced great price action and seems that might have finish Wave (ii) now as it seems to have stalled at previous Wave [ii] support again.
There are divergence indications by the RSI and MACD on the hourly chart that suggest that Wave (iii) might start pretty soon moving upwards.
If impulsive moves start producing to the upside it will suggest that Wave (iii) has started, although further moves to the downside would make me rethink the whole count again.
60Mins
4Hours
Daily
Weekly
All the best for everyone.
Andres


 Trading Waves .org