Wed 16-01-2019
USDJPY
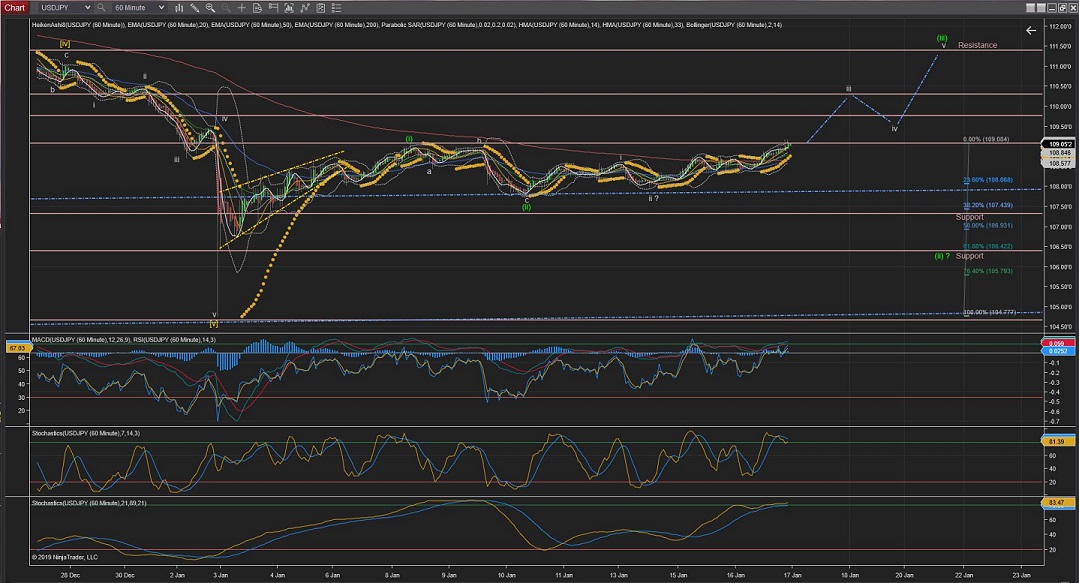
USDJPY; still not much action today and the mmoves up are not very impulsive so... would stick to the current count at the moment (slightly more convincily if the price goes above Resistance levels of Wave (i) @109.06, although the alternative count to the lowest Support levels is still a real posibility.
60Mins
4Hours
Daily
Weekly
USDCAD
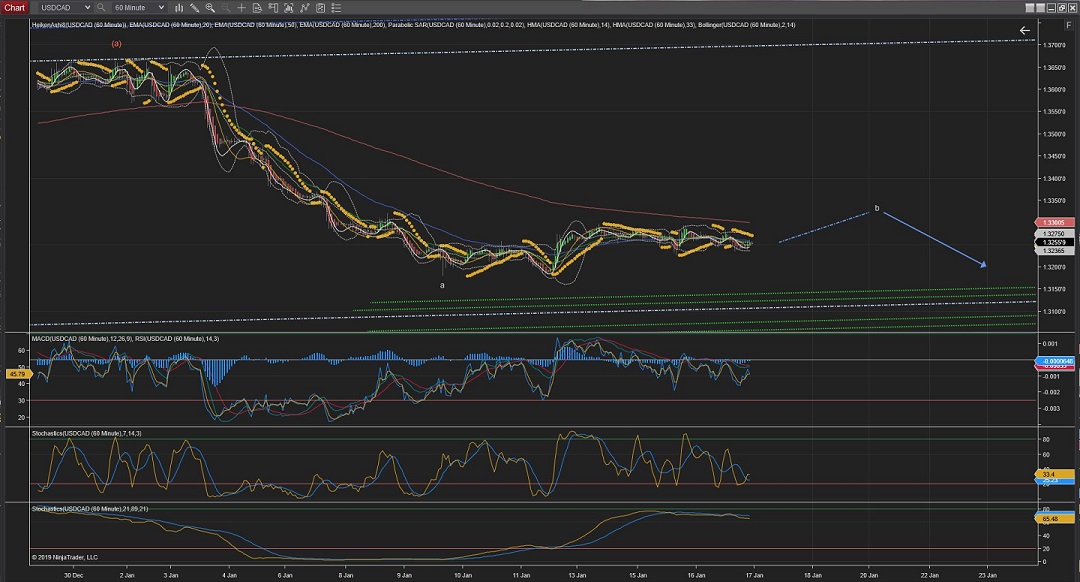
USDCAD looks to be in the middle of a Wave b (Within Wave (b)); Best seen in the 4 Hour Chart.
And looking at the 4 Hour Chart this potential 3 wave structure within the smaller Wave b could finish in the 200EMA.
So this could be the turning point to initiate the final bit of the move towards the lower Trend.
60Mins
4Hours
Daily
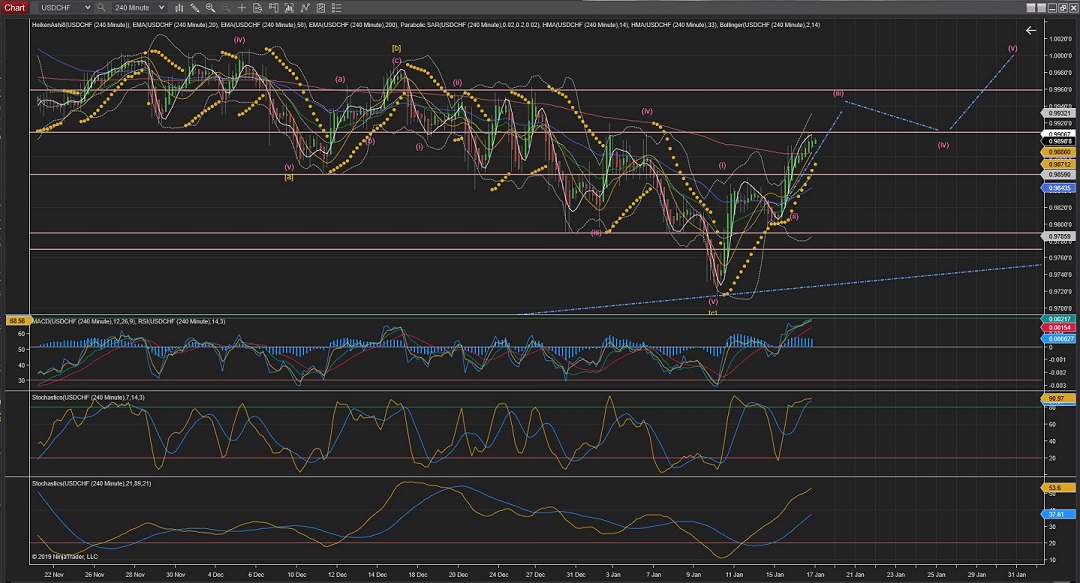
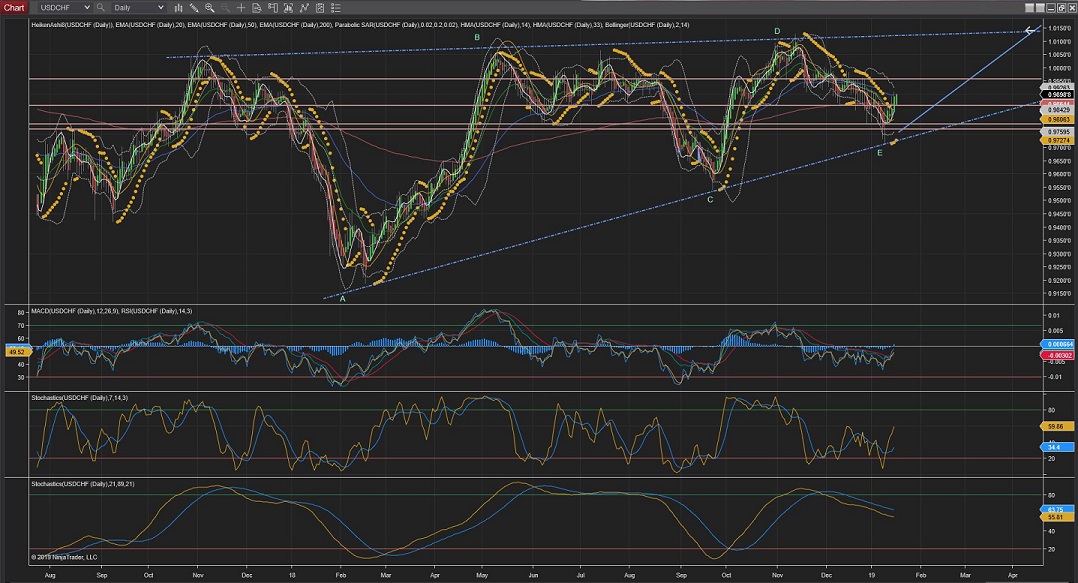
USDCHF
USDCHF passed the highest of Wave (i) @0.9848 which should now serve as the Support.
And Wave ii of Wave (iii) is underway; Hard to say which type of correction it is but, once completed (above 0.9848), Wave iii of Wave (iii) should trigger another impulsive move towards Resistance levels @0.9959.
60Mins
4Hours
Daily
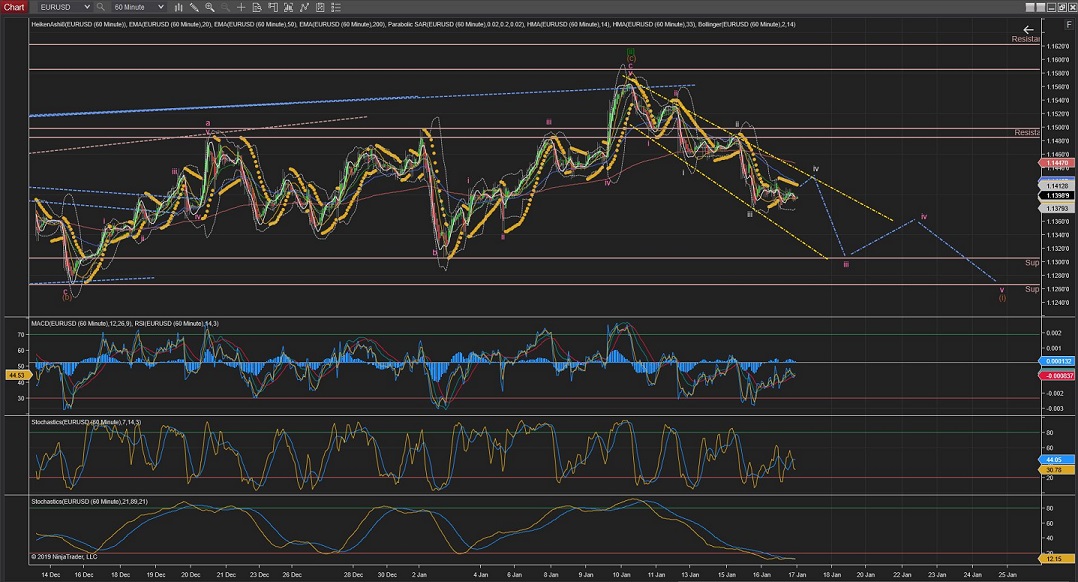
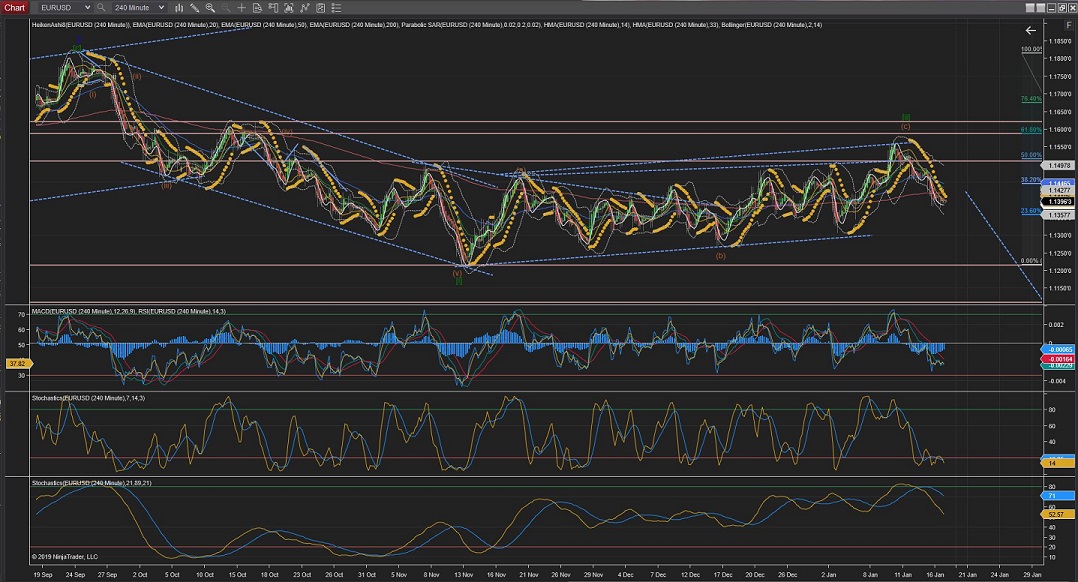
EURUSD
EURUSD looks like it is now going through the 4th Wave of Wave iii and tomorrow should expect Wave iii to touch Support levels @1.1305 before the Wave iv correction commences.
60Mins
4Hours
Daily
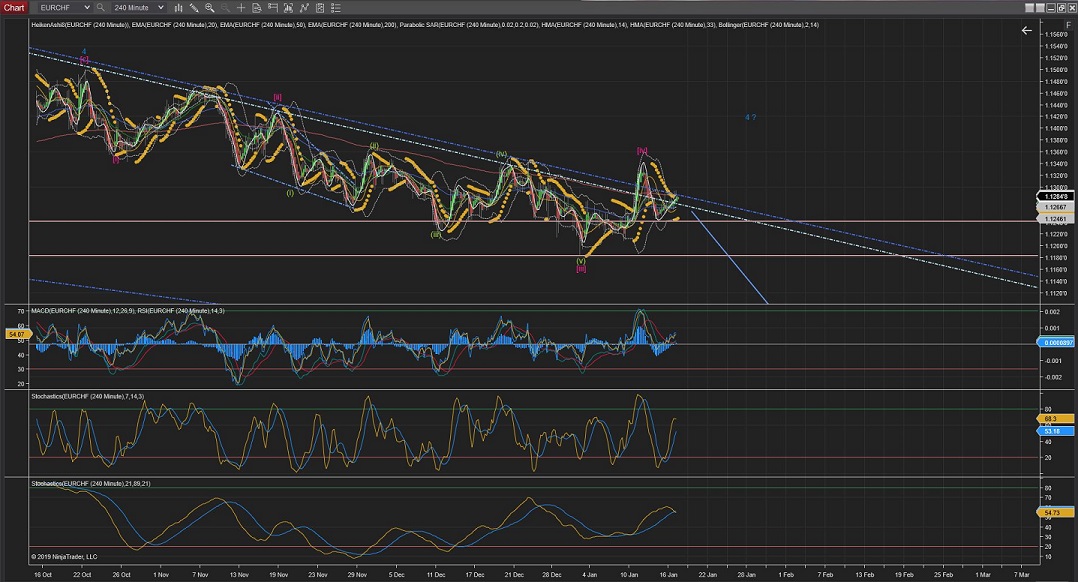
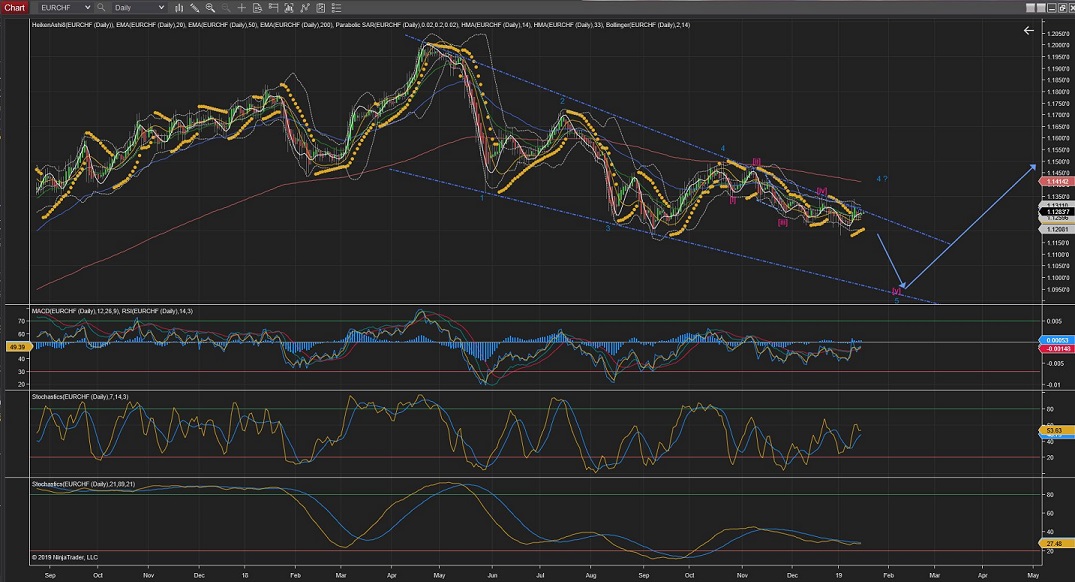
EURCHF
EURCHF: The Heads and Shoulders (top) formation with what appears to be Wave ii of Wave (iii) has not yet dropped to the downside and instead looks like developing a H&S bottom which could trigger to the upside.
And if it does rally to the upside more than the trend line it would trigger the alternate count and possibly going towards the 200EMA(Daily Chart) for an extended Wave 4.
For now, will keep the current count on the chart...
60Mins
4Hours
Daily
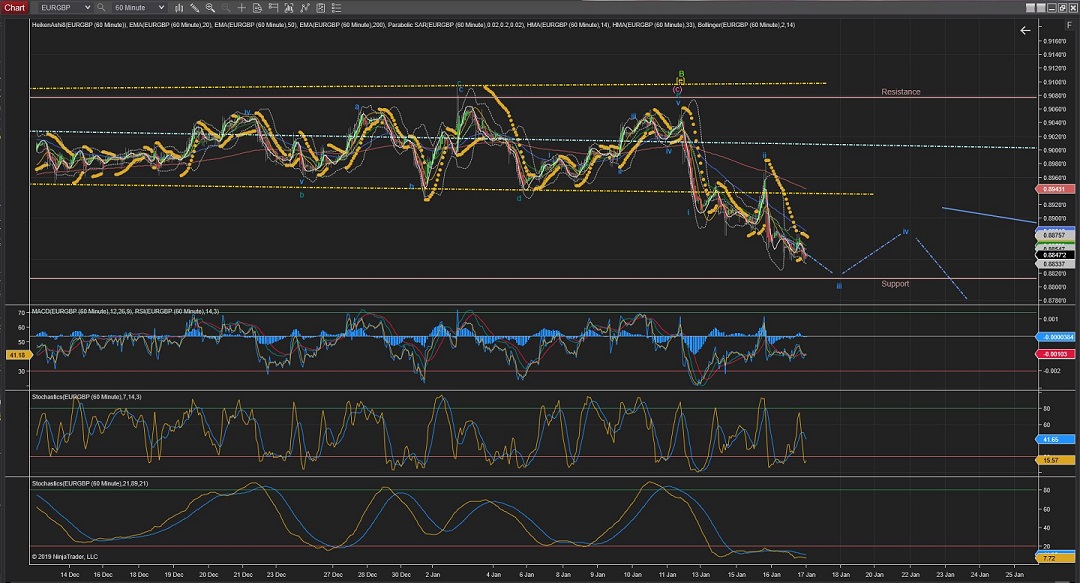
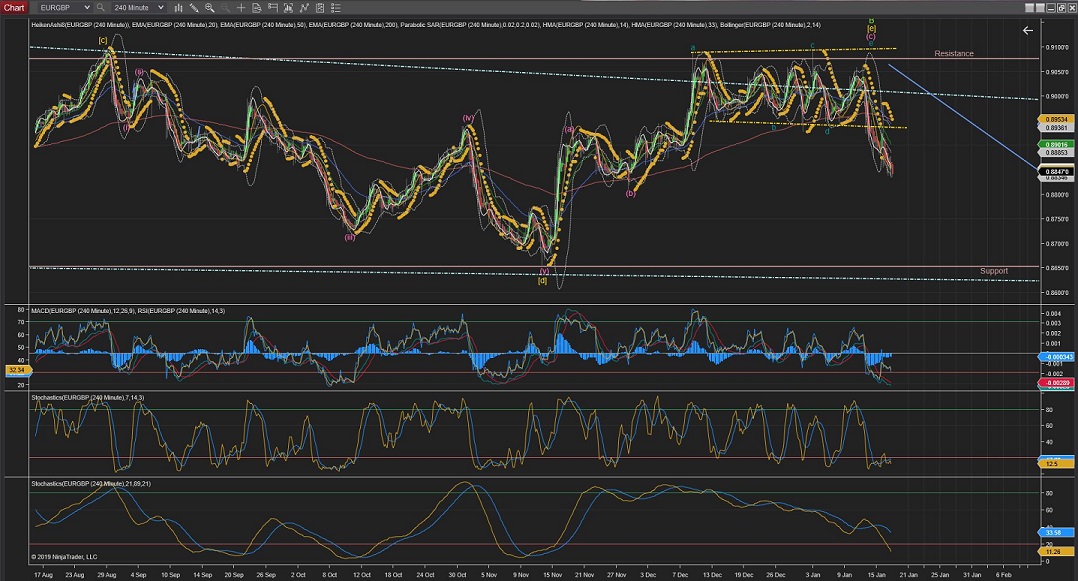
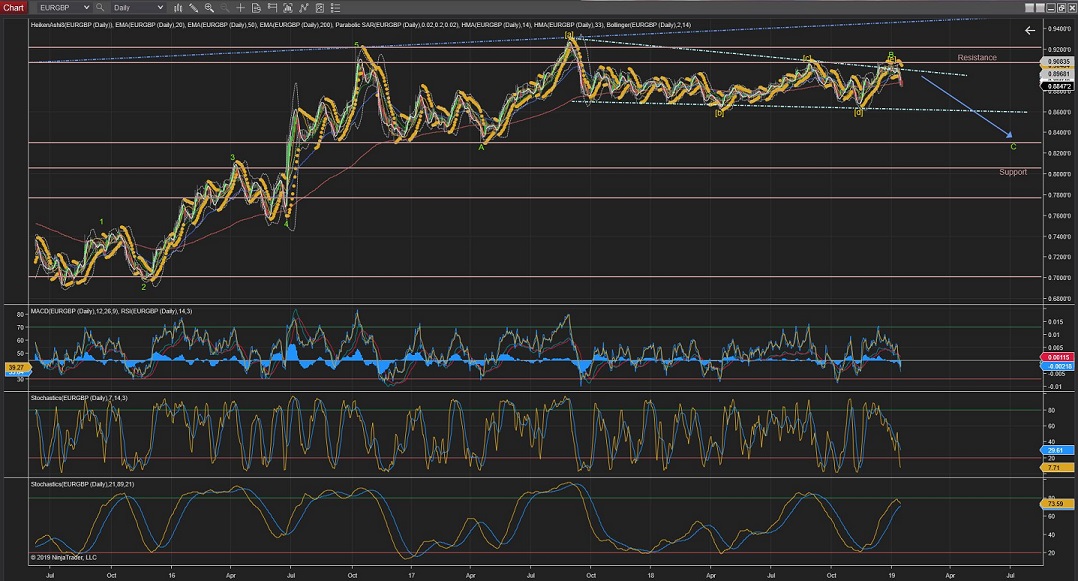
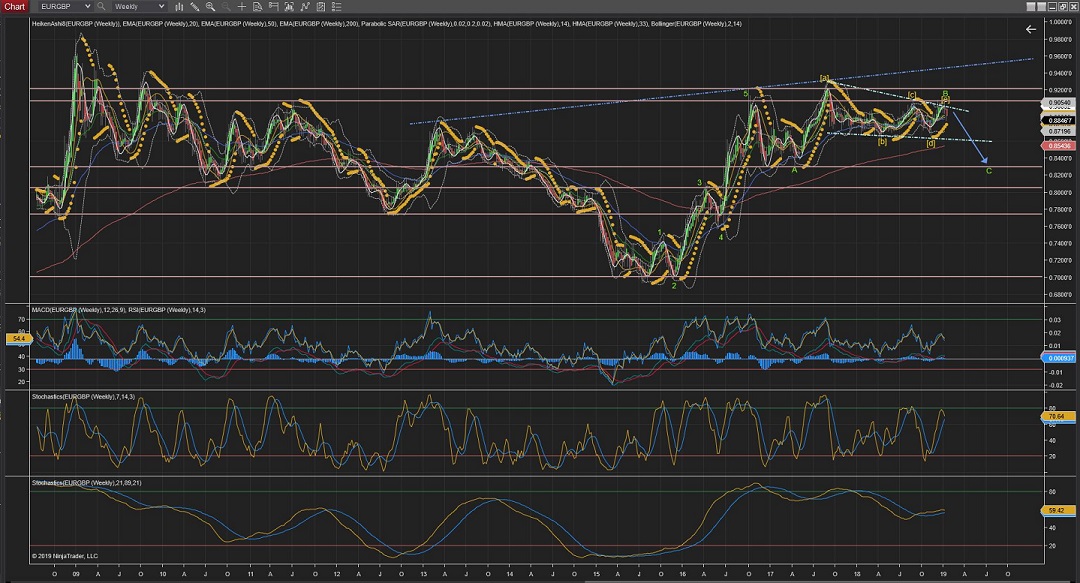
EURGBP
EURGBP is moving slowly to the downside what appears to be a Wave iii and should expect that to continue until it hits the Support levels (@0.8812) before it bounces again for a corrective Wave iv.
60Mins
4Hours
Daily
Weekly
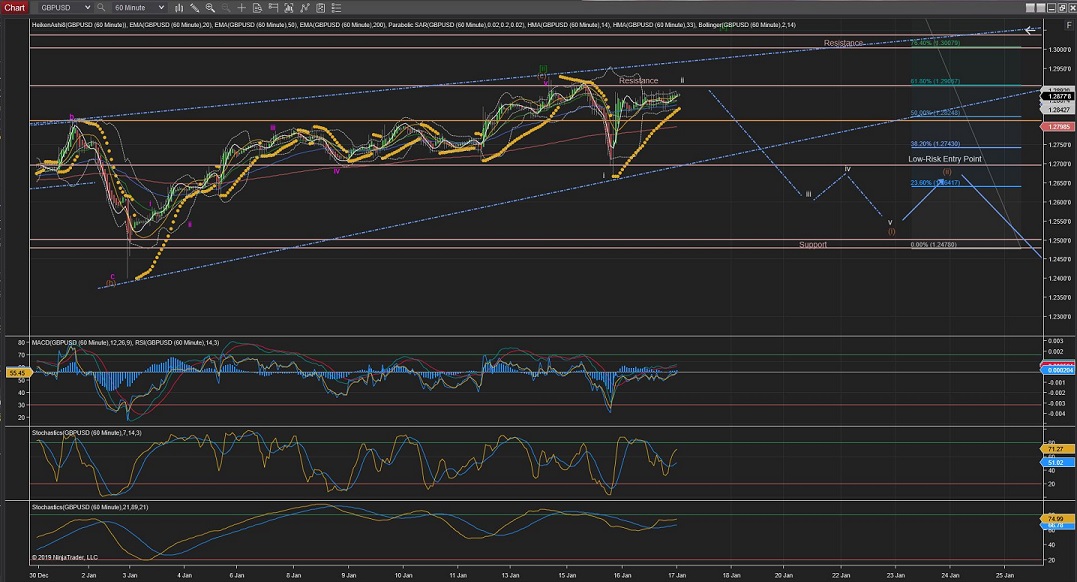
GBPUSD
GBPUSD indicators and trend levels favour more the alternate count for a higher Wave [ii] - Best seen on the 4Hour Chart.
Although the 1Hour Chart does favour the current count for a Wave iii to start soon.
The price action tomorrow should confirm the correct count.
60Mins
4Hours
Daily
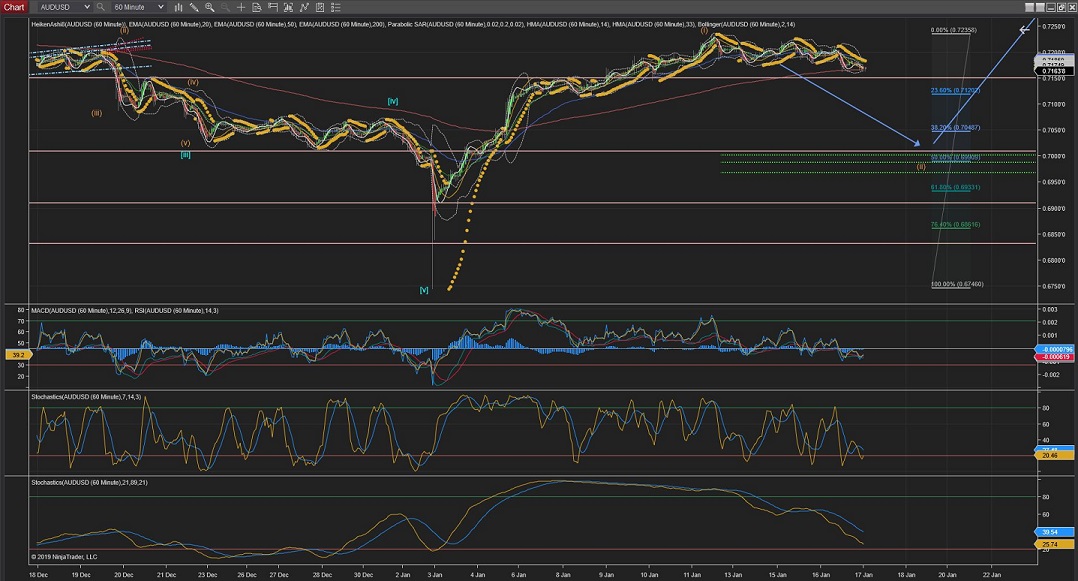
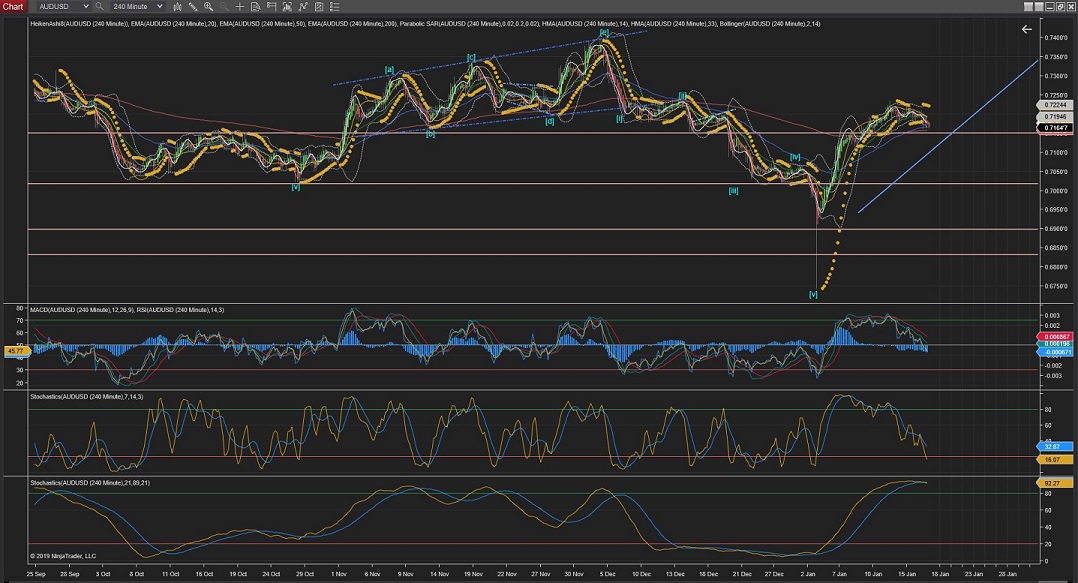
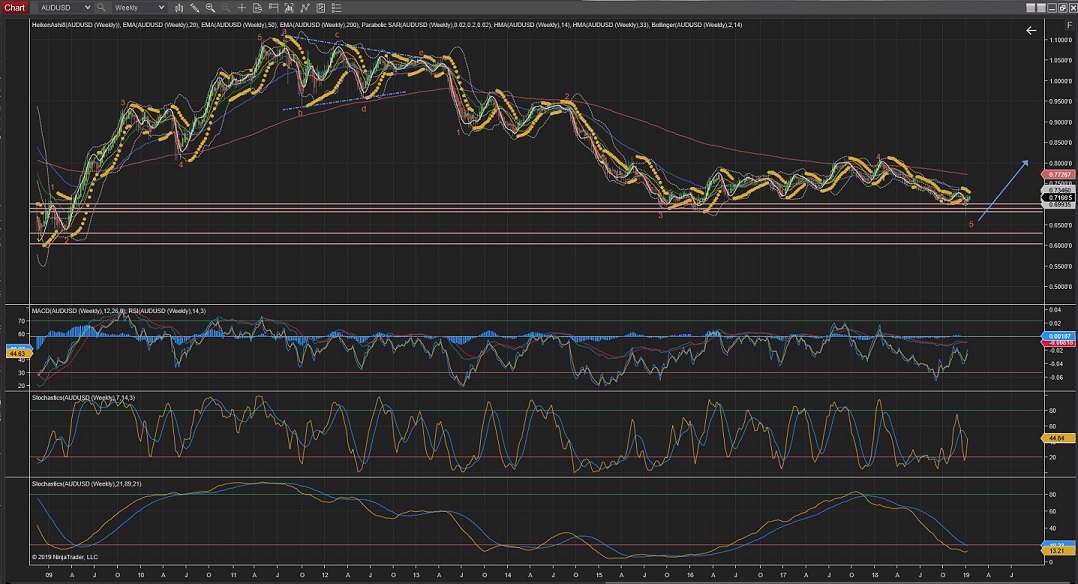
AUDUSD
AUDUSD is starting to show some slight movement to the downside to what potentially could be Wave (ii).
Price action is been really quite upto now so, if that changes, maybe some movements could finally start to define some waves that can be worked on.
60Mins
4Hours
Daily
Weekly


 Trading Waves .org