Fri 30-04-2021
Hi everyone, hope you are all great.
So... Let's get into it...
USDJPY
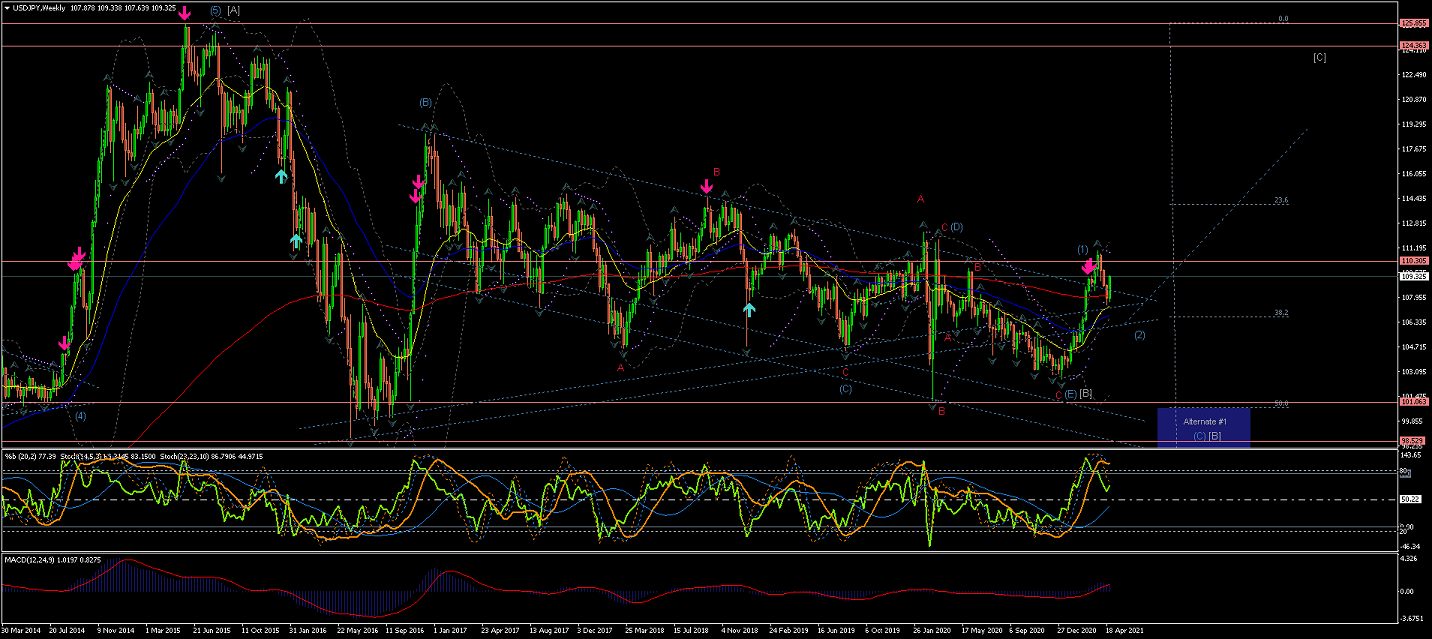
Weekly Chart is showing Wave (1) could be completed now that the price has crossed the upper long-term trendline...
A rise from the lower trend line, after the this long-term correction, under the current count,
suggests the beginning of the start of Wave (1) of a long-term raise.
(a drop across the %50 retracement would favor Alternate #1 count for an extended Wave (C) of Wave [B] correction towards the %62)
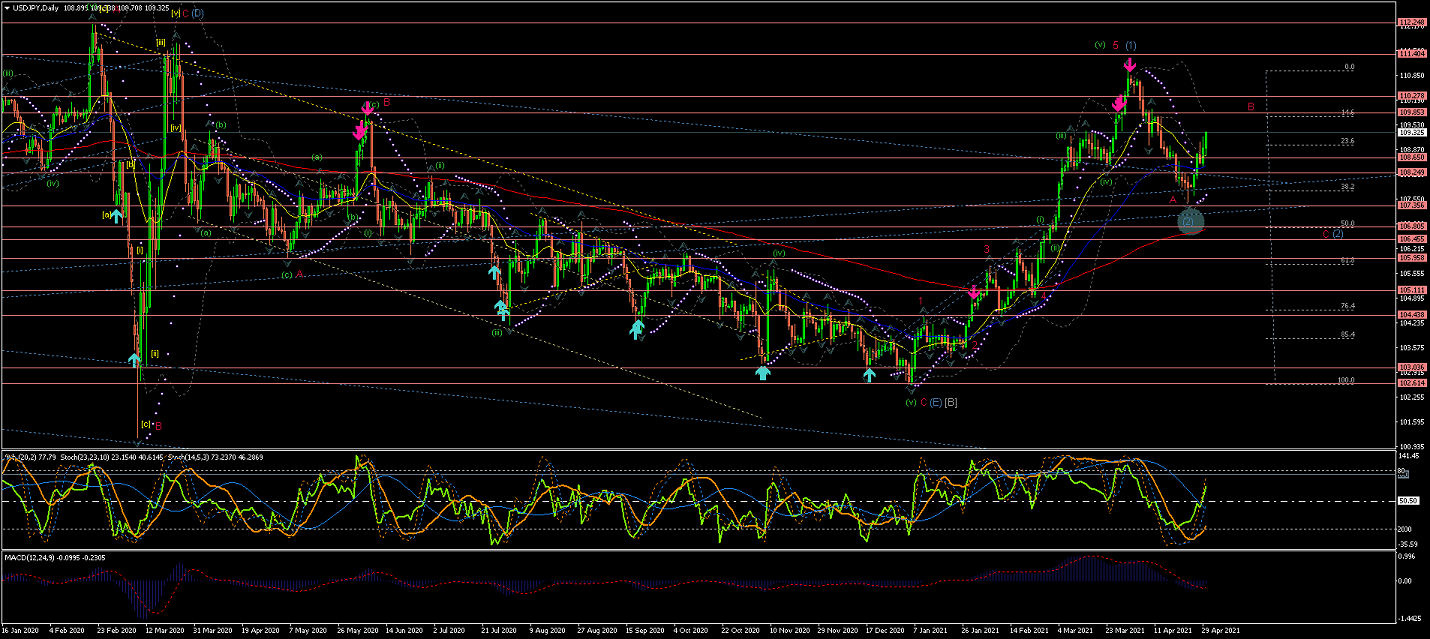
Daily Chart is been showing Wave (1) should be completed as the price has now crossed the EMAs impulsively after nearly a year... let's see the price reaction to the long-term Trendline (blue)...
At first glance Wave (2) has already hit the %38 retracement of Wave (1)... so could be completed...
Although I have marked that as the Alternative count, as it seems that the move could be just its internal Wave A(red) completed...
And now Wave B(red) underway...
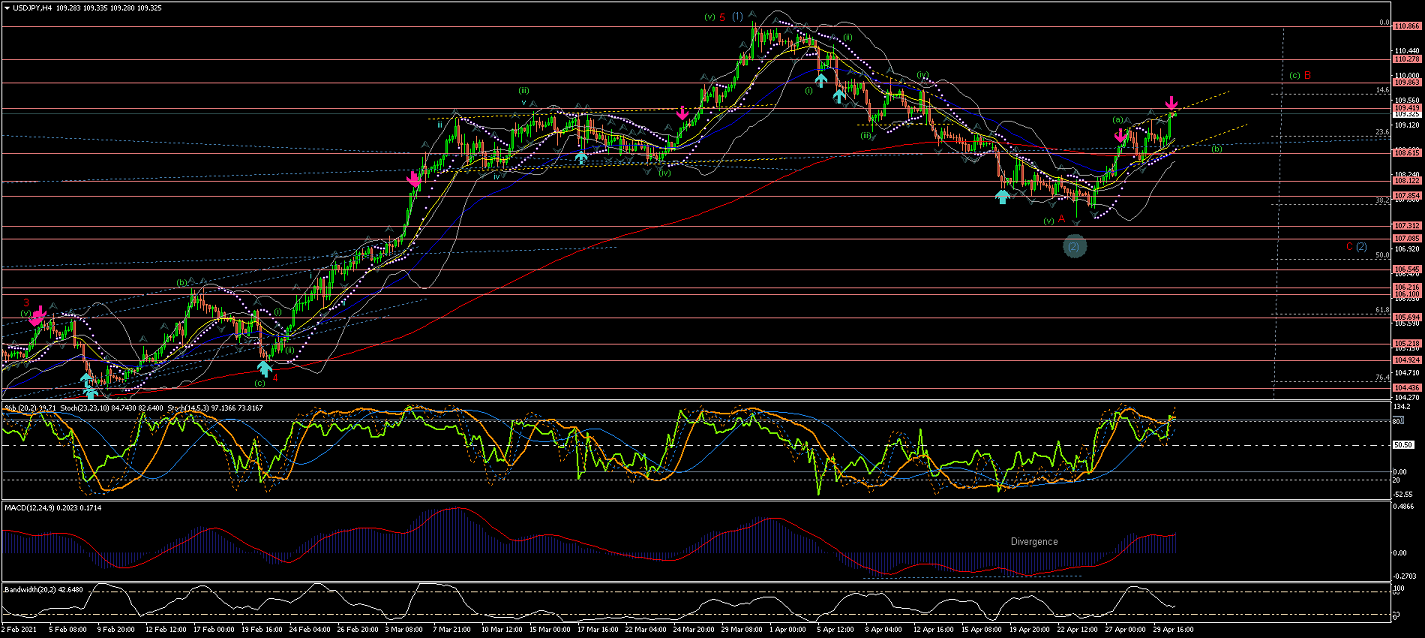
4Hour Chart is showing the corrective Wave (2) completing its internal Wave A(red) below all EMAs (with 5 waves)...
suggesting a Zig-Zag pattern ahead (5-3-5)...
With Wave (a) of Wave B(red) possibly already completed... and Wave (b) now developing withing an Ascending Range...
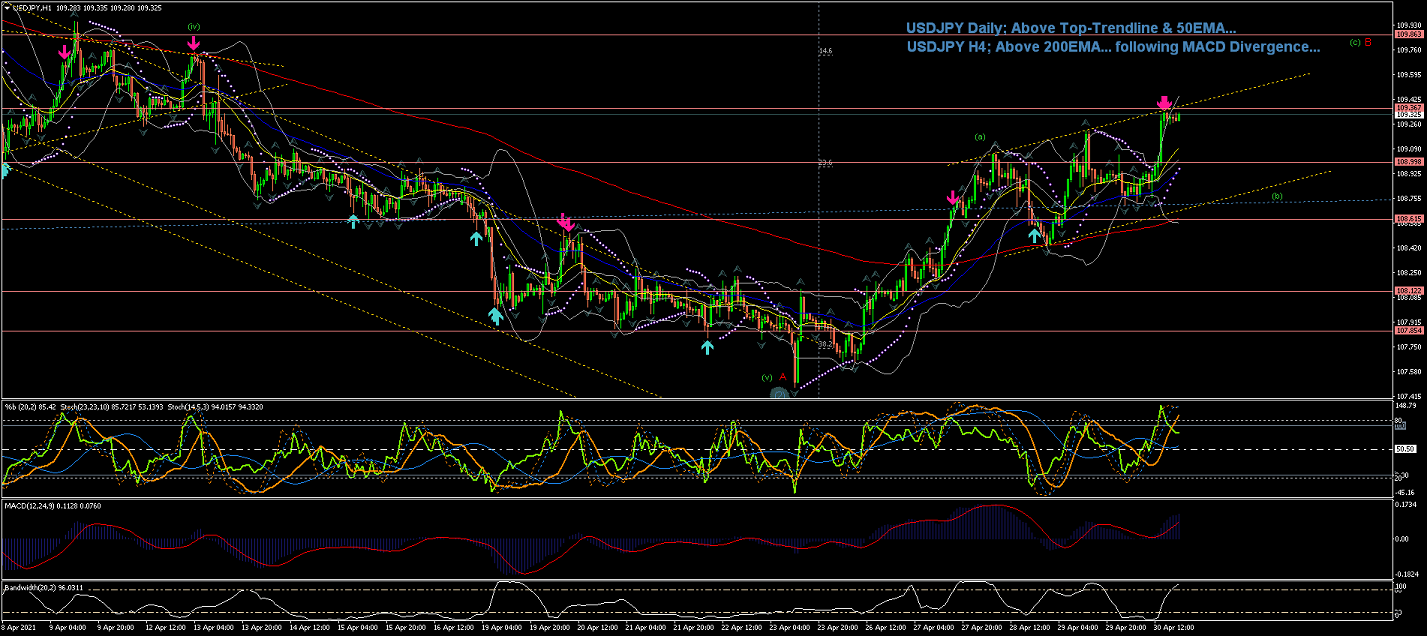
60Min Chart shows a close up of the mentioned Wave (b) of Wave B(red) of Wave (2)...
currently developing within an Ascending Range...
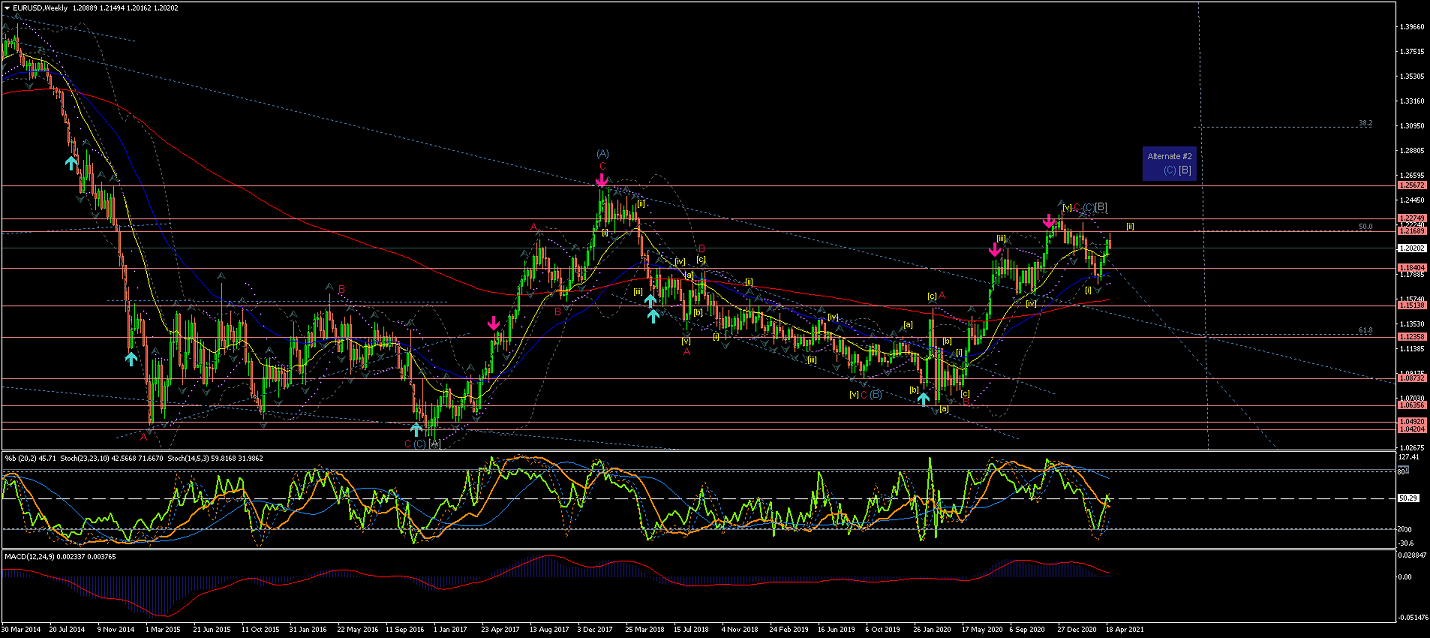
EURUSD
Weekly Chart is showing an extended Wave C(red) of Wave (C) of Wave [B] now most likely at completion...
And showing signs of the price reverting into a down Trend as it heads down towards the EMAs...
Notice the Alternate #2 for more extensive correction of long-term Wave [B] to have in mind.
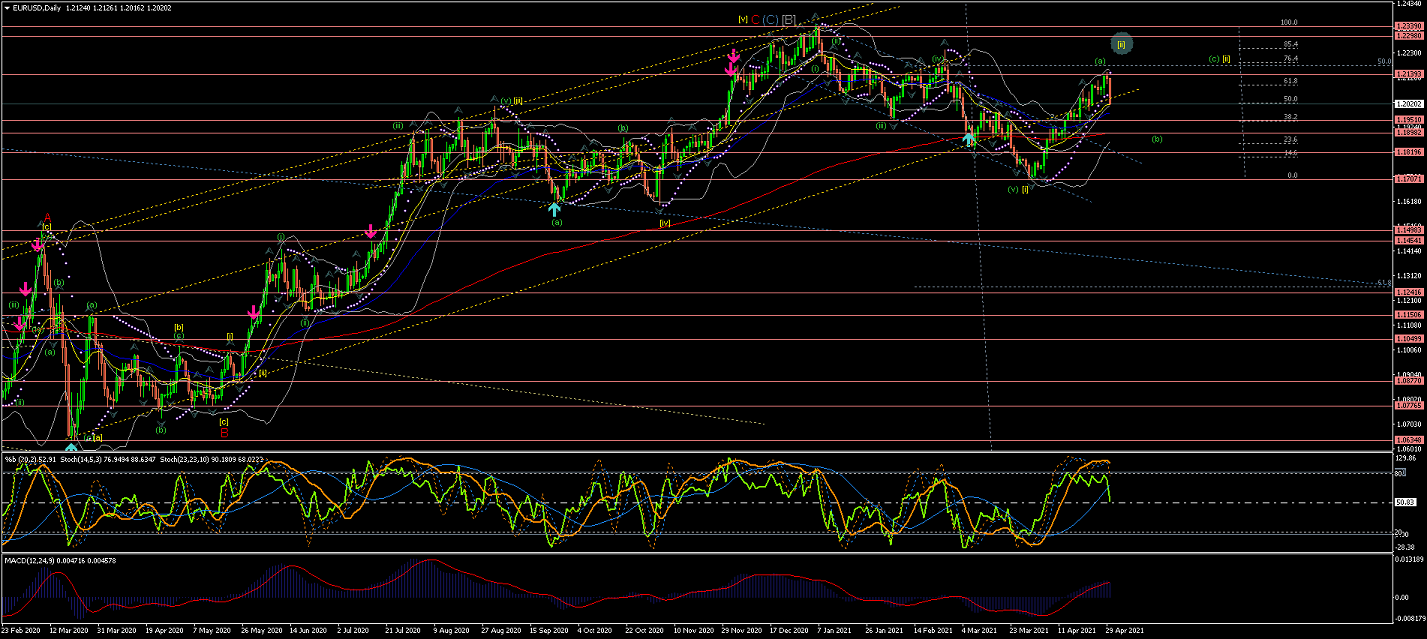
Daily Chart is showing Wave C(red) most likely completed at the top trendline of the Trend Channel(yellow).
And now the price as it is crossing the 200EMA and lower Trendline for the potential of a new long-term Trend to the downside...
Especially now that Wave [i] seems to be completed...
So Wave [ii] underway, but be aware of the price re-entering the Trendline (yellow)...
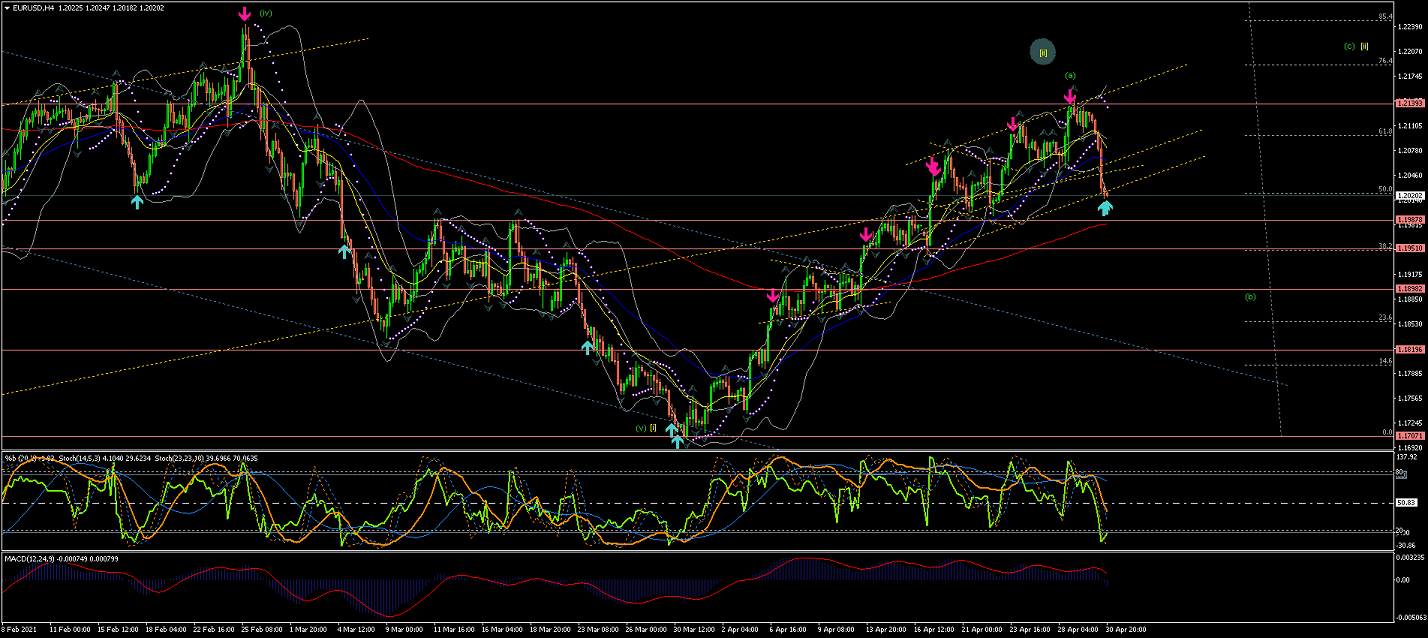
4Hour Chart is showing Wave (a) of Wave [ii] now possibly completed...
Although the Alternate count is pointing at the whole Wave [ii] completed instead,
as the price has already reached between %62 and %76 retracement of Wave [i]...
(Wave [iii] would be confirm once the price breaks below the lowest of Wave [i] @ 1.17071)
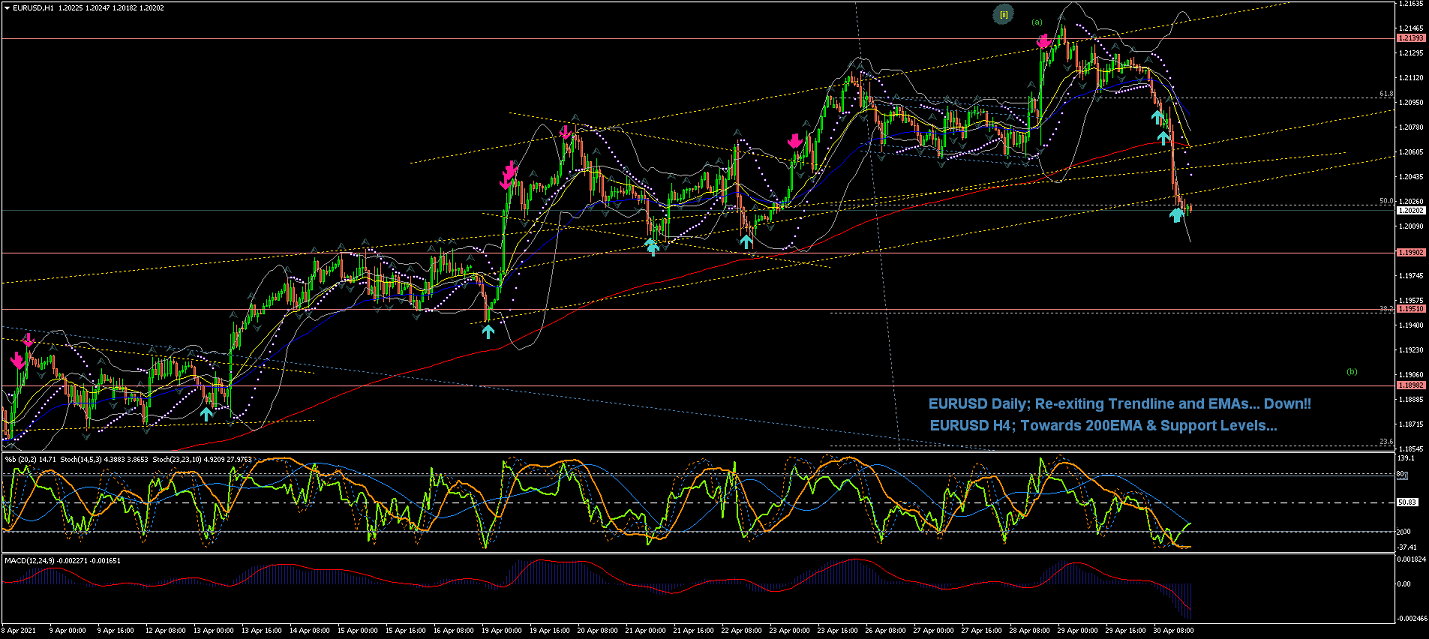
60Min Chart is showing a continuous rise that has found crossing the %62 retracement of Wave [i]...
So watch out for the potential start of Wave (b) of Wave [ii] to bring the price down below the EMAs again...
Unless Alternate count for an already completed Wave [ii] is triggered, which would bring the price much lower...
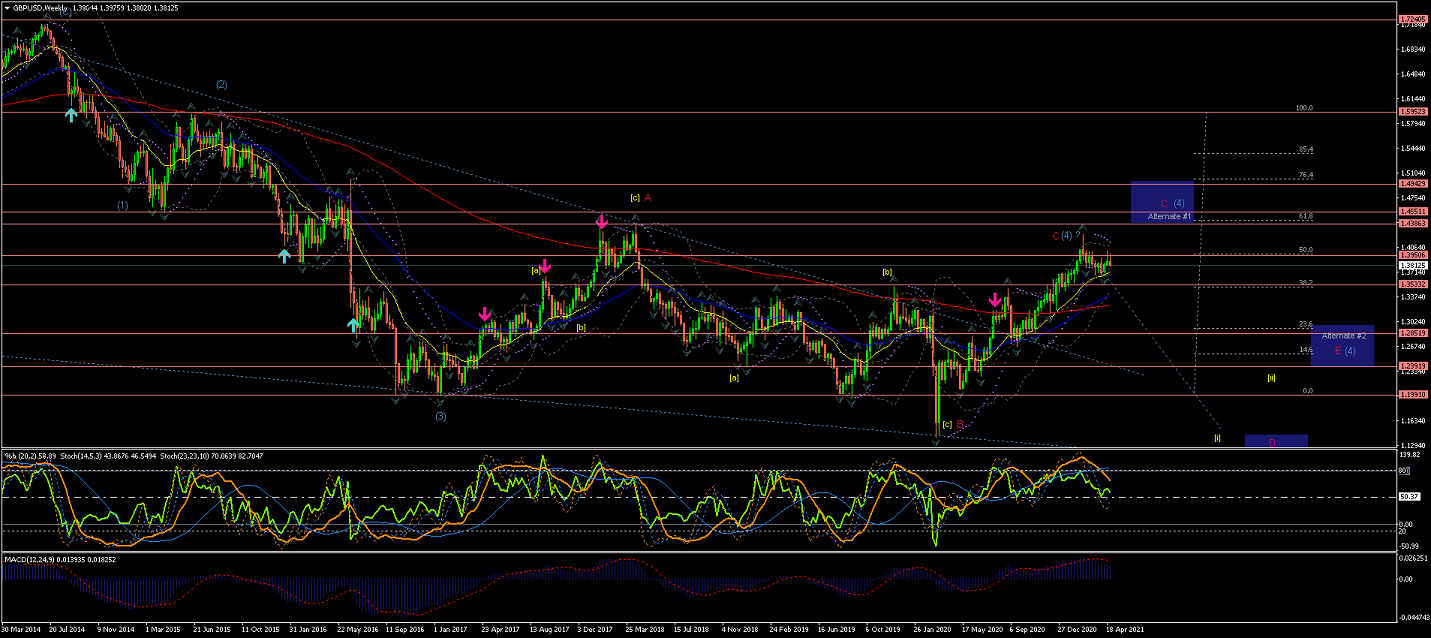
GBPUSD
Weekly chart shows an extended Wave (4) correction crossing the 200EMA in a rather struggling way...
At the current resistance points the price could start coming down lower to start Wave (5)
or continue higher as Alternate #1 suggests...
Regardless of the direction, the moves still look very weak and corrective...
(Note Alternate #1 for a possible larger Wave (4) developing...).
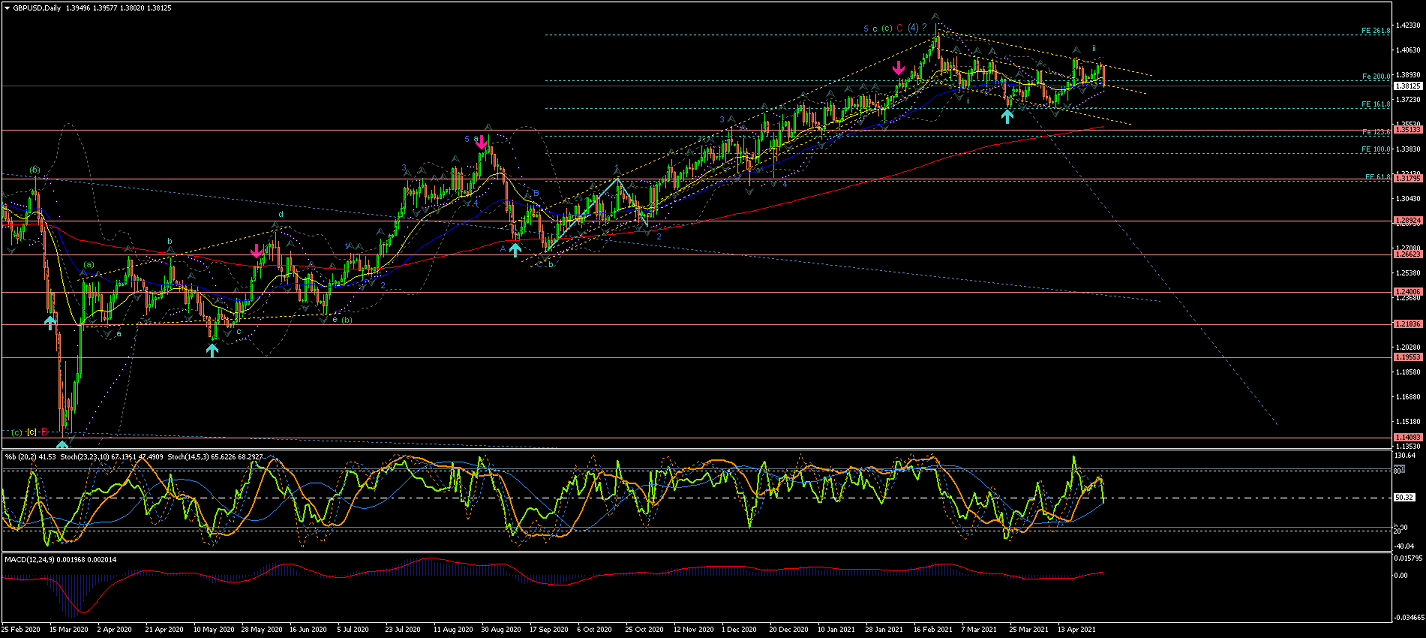
Daily Chart is showing the Wave C(red) completing Wave (4) in what should then be a false breakout
of this long term triangle formation (blue long-term trendline).
If this is a false breakout the moves could start bringing the price down impulsively and re-entering the blue long-term trendline.
Next, if this count is correct, we should expect the price to continue the moves down impulsively for Wave (5)...
but, for that, the price still needs to complete the breakout of the current tight Ascending Range formation (yellow) and cross the EMAs...
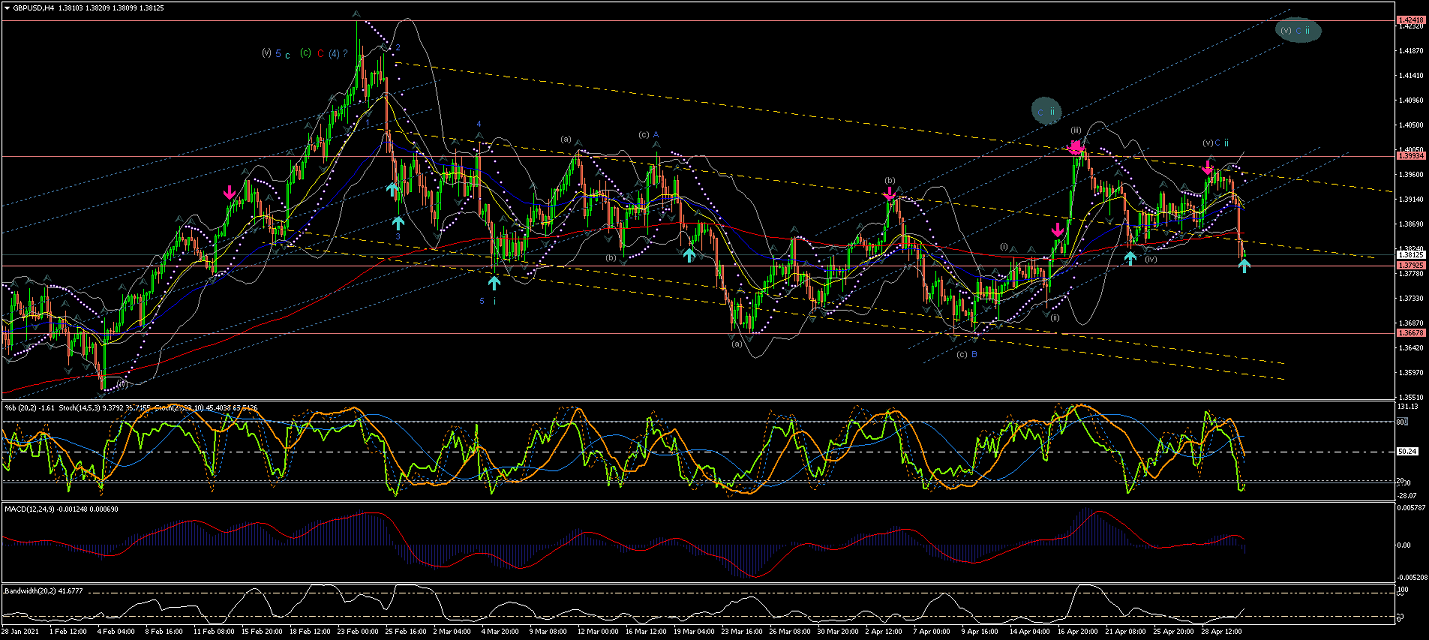
4Hour Chart shows Wave (4) correction completed as it remains the highest point since February...
And the price has already breaking through the Blue Range to the downside... forming a Descending Range(yellow)...
Next, I would wait for the price to confirm the start of Wave (5), before committing to short positions.
(i.e. breaking current Market Structure (yellow trendline) and EMAs to the downside in an impulsive way)...
which appears to be doing... as the latest moves down are showing Waves i & ii of Wave (i) (green) to the downside...
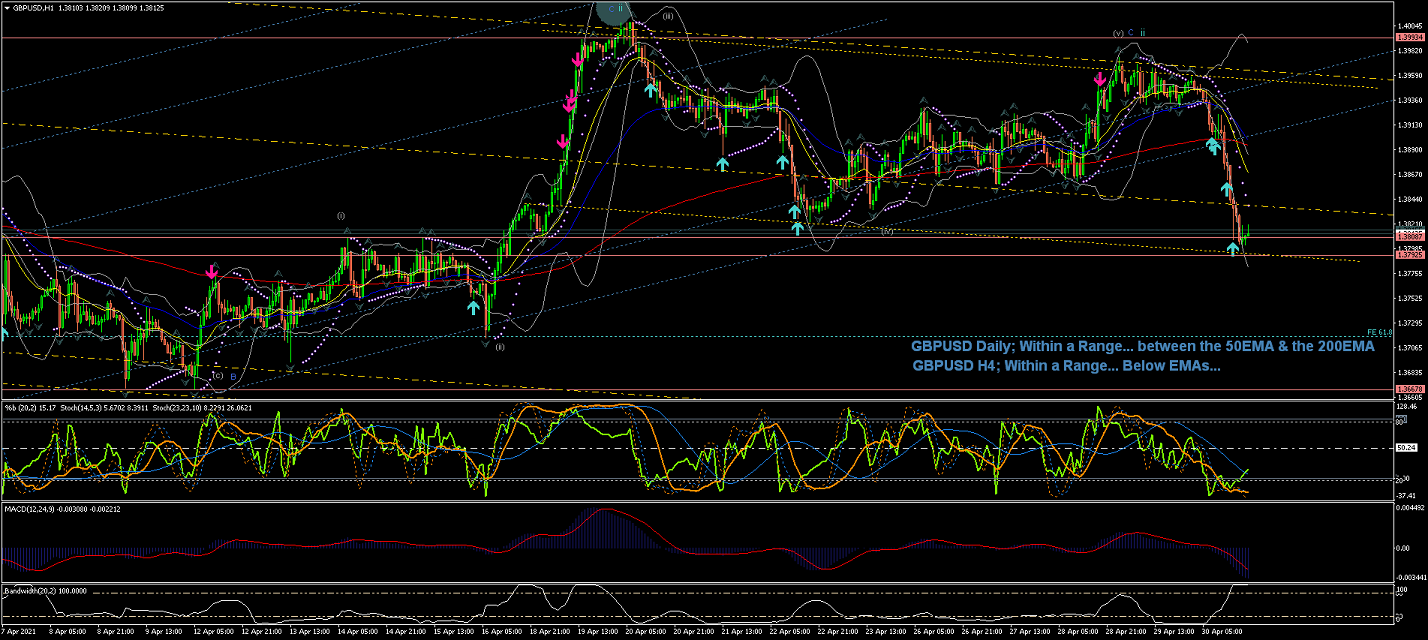
60Min Chart is showing the internal Waves (i), (ii), (iii), (iv) & (v) of Wave C(blue) of Wave ii...
(where Wave (v) turned to be a false Wave (v) as it failed to reach above Wave (iii)...)
So watch out for the start of Wave iii confirmation... to bring the price further to the downside...
All the best for everyone and please do not hesitate to contact me if you have any questions or comments.
Andres
info@tradingwaves.org
Please be aware: that these Analysis are own opinions, not Trading advice; Trading carries a high level of risk, and may not be suitable for all investors. Before deciding to trade you should carefully consider your investment objectives, level of experience, and risk appetite.
 Trading Waves .org