Fri 26-02-2021
Hi everyone, hope you are all great.
So... Let's get into it...
USDJPY
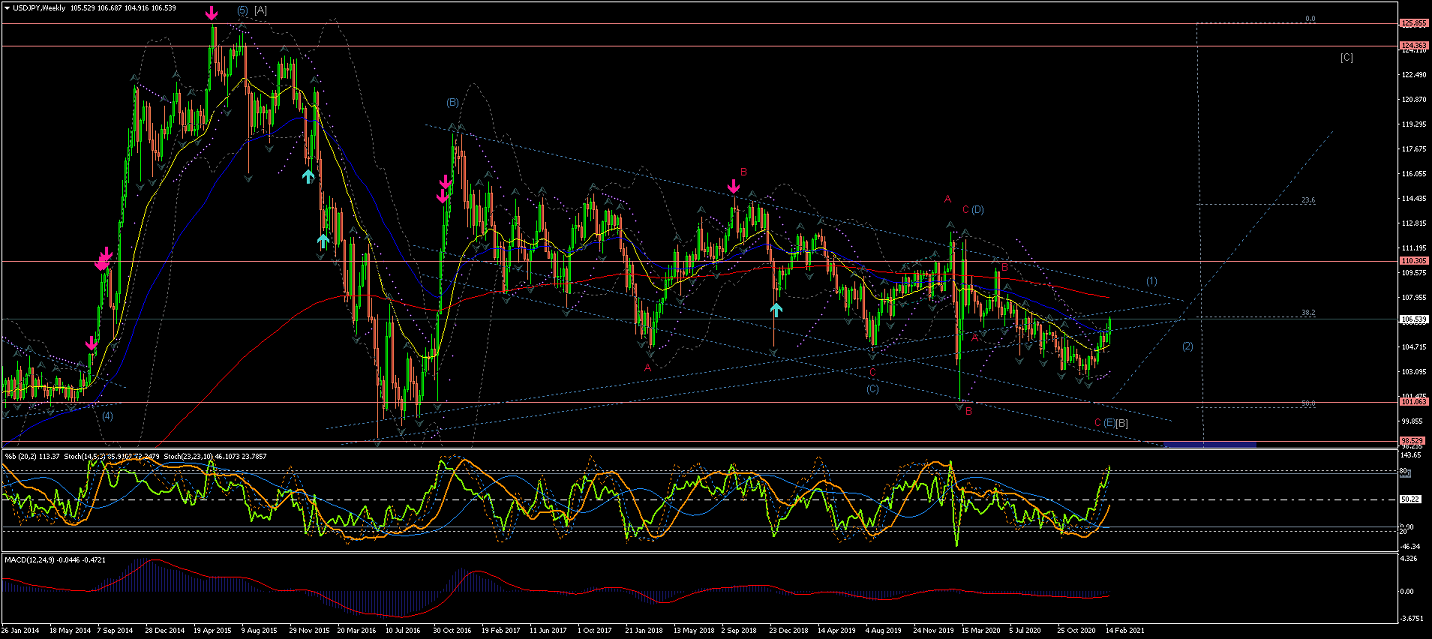
Weekly Chart is showing Wave (E) could have been completed if the price re-enters
the lower triangle trendline, to complete this long term choppy correction...
A rise from the lower trend line, after the this long-term correction, under the current count,
would suggest the beginning of the start of Wave (1) of a long-term raise.
(a drop across the %50 retracement would favor Alternate #1 count for an extended Wave (C) correction towards the %62)
Daily Chart is been showing the current Wave (E) could have found the bottom as the price is crossing the 200EMA after nearly a year... let's see if this impulsive raise continues across the 200EMA...
Act with caution; ... but these could be early signs of a new trend up starting...
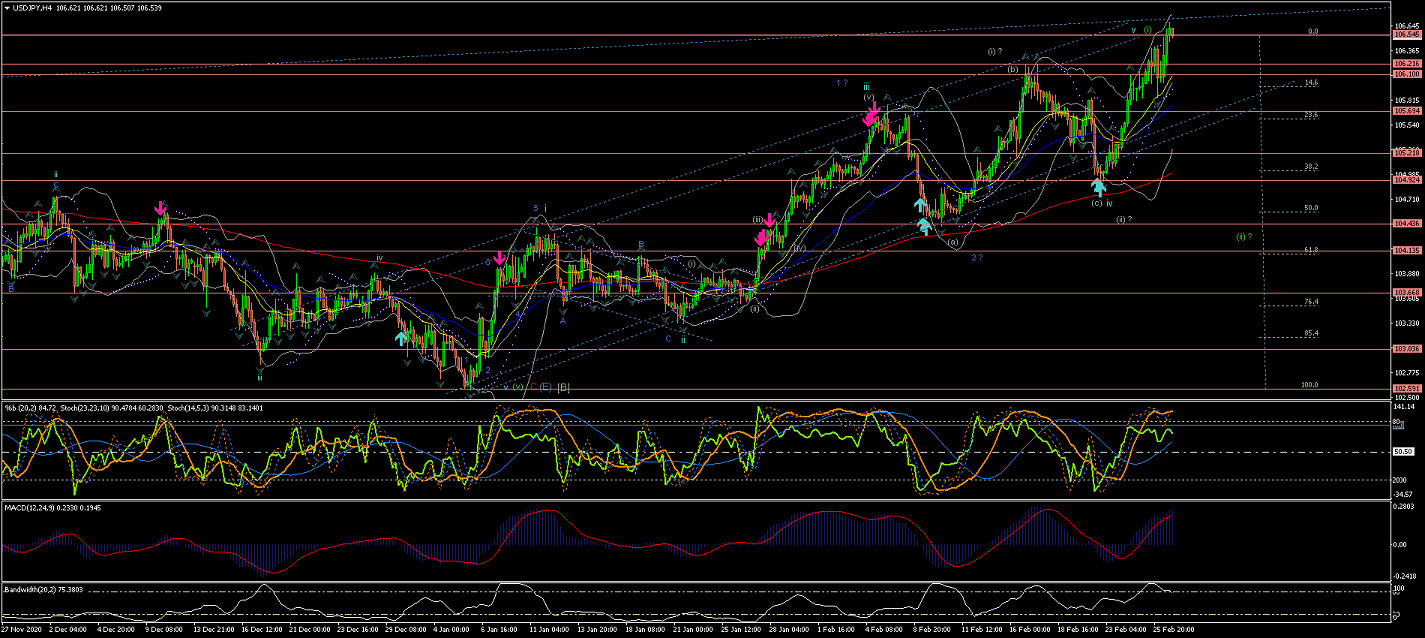
4Hour Chart is showing the potential completion for the initial Wave (i) now that the price is so close to a long term trendline we should be cautious of the potential of a larger corrective Wave (ii)...
Note how I marked two Alternative counts that suggest a more bullish approach... Marked with the "?" sign...
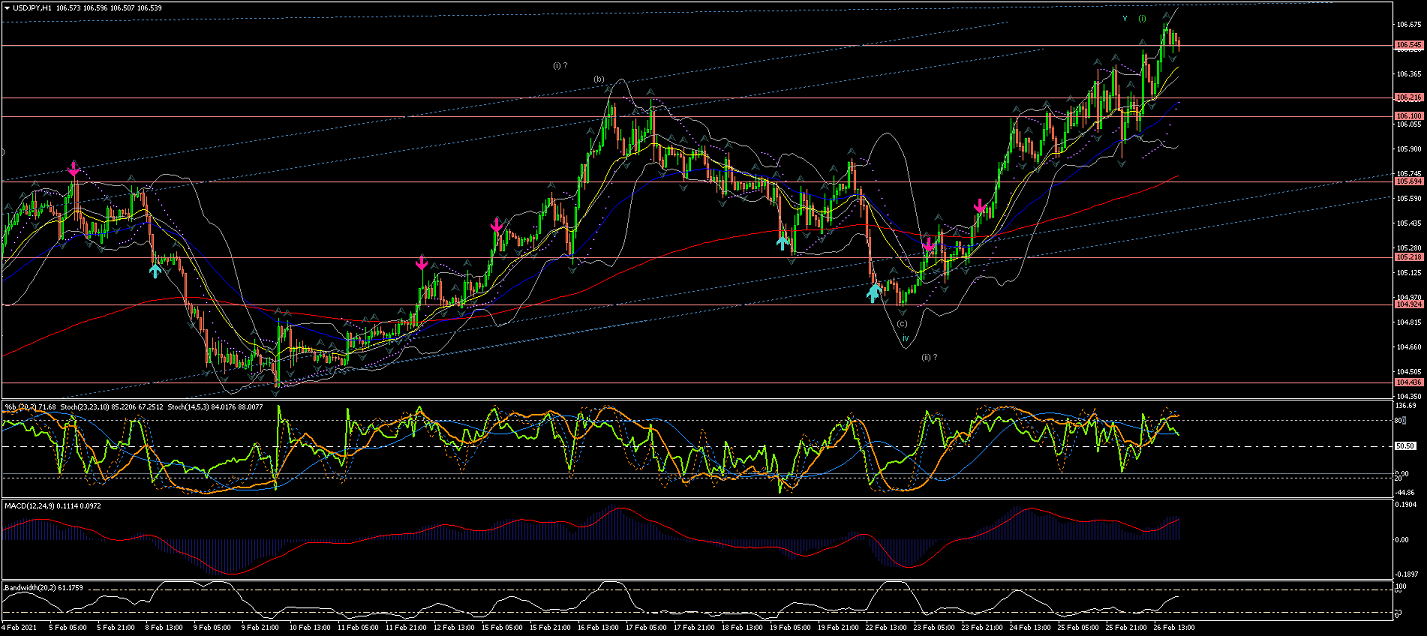
60Min Chart shows the potential for this new Trend up... with 5 Waves completing Wave (i) within an Ascending Range...
The Alternate count (marked with question marks) now suggest Waves (i) and (ii) of Wave v still underway...
However, the main count suggests Wave (ii) correction to bring the price lower in 3 waves...
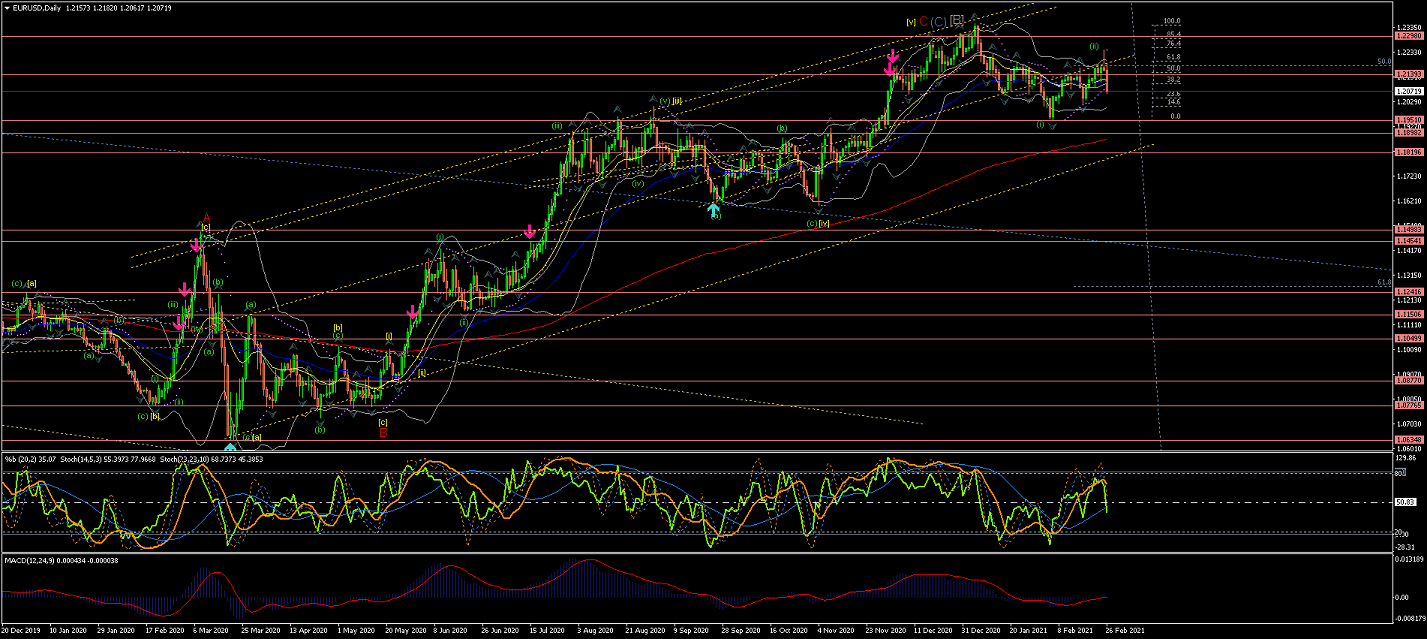
EURUSD
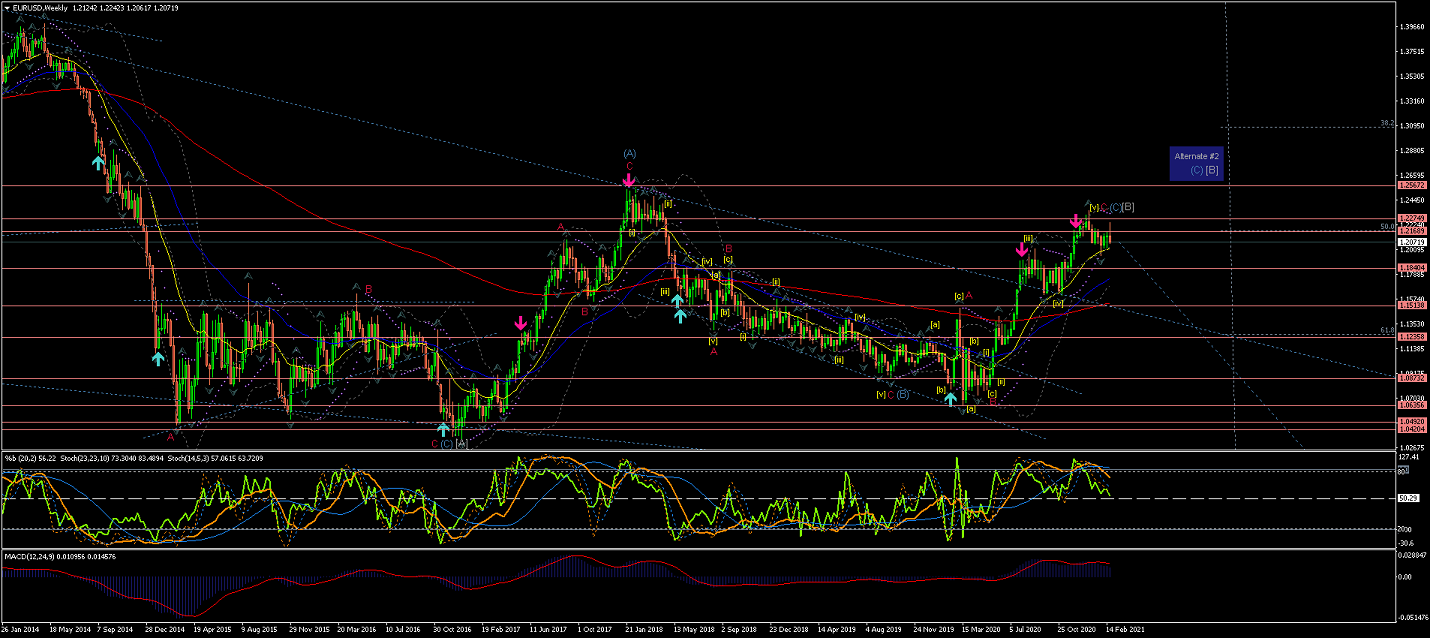
Weekly Chart is showing an extended Wave C(red) now most likely at completion of its internal Wave [v].
Notice the Alternate #2 for more extensive correction of long-term Wave [B] to have in mind.
Daily Chart is showing Wave C(red) completed with Wave [v] most likely completed at the top trendline of the Trend Channel(yellow).
So watch for the price to head towards the 200EMA and lower Trendline for the potential of a new long-term Trend to the downside...
Especially now that Waves (i) and Waves (ii) have completed, under the current count...
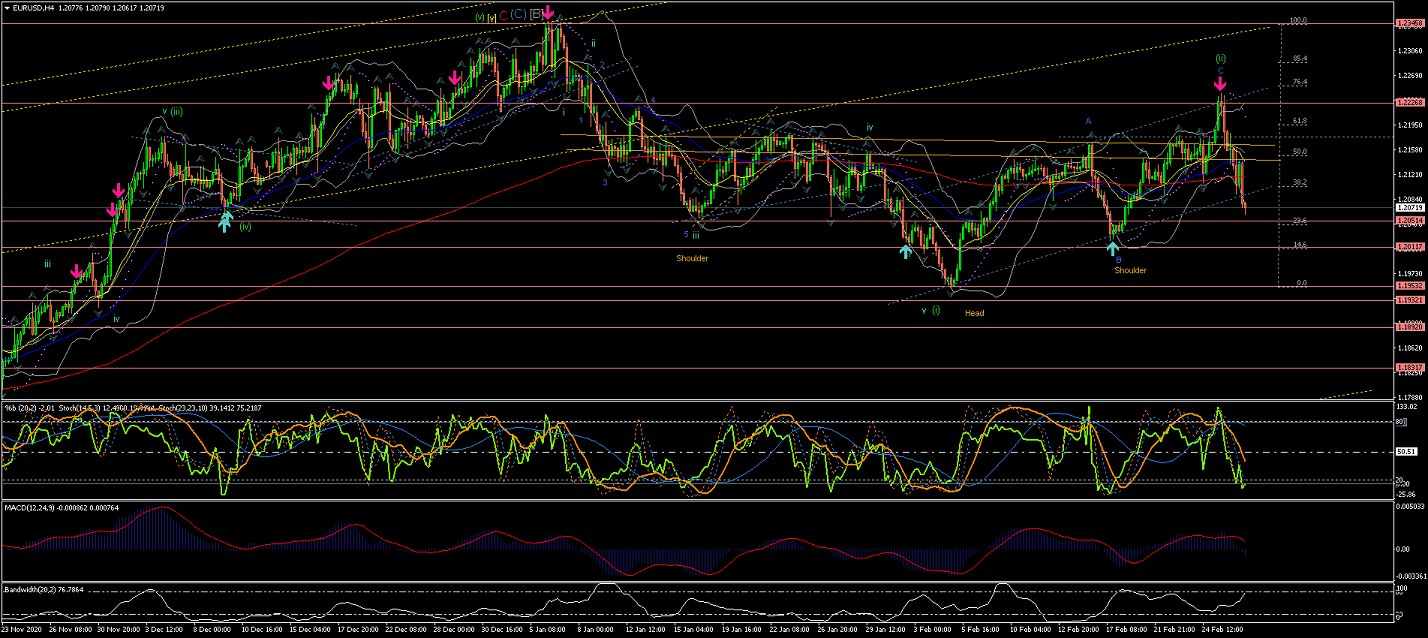
4Hour Chart is showing a reasonably impulsive Wave (i) completed and Wave (ii) most likely completed at %76 retracement of Wave (i)... while creating a Head & Shoulders Formation that seems to be breaking to the downside as it also breaks out of the (blue) Range and all of the EMAs.......
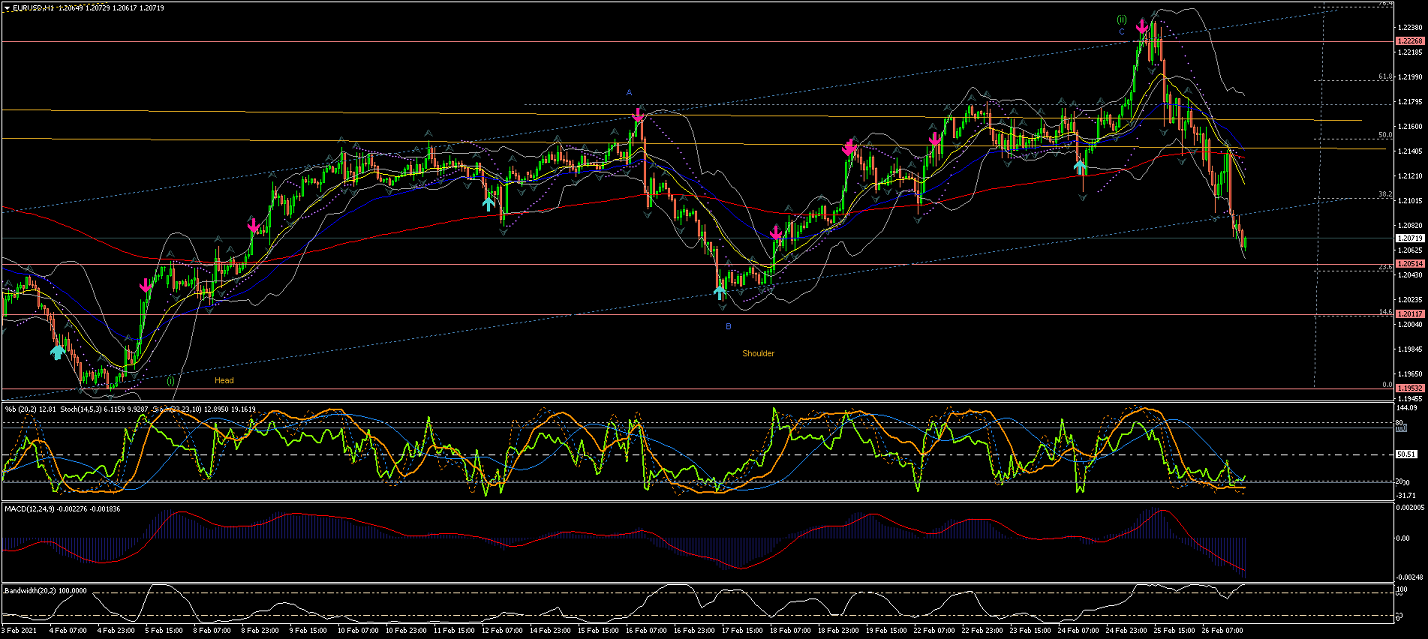
60Min Chart is showing a close up of how Wave (ii) could be confirmed completed once the price fully breaksout of the current Range(blue) and crosses the lowest of Wave (i) @1.19532...
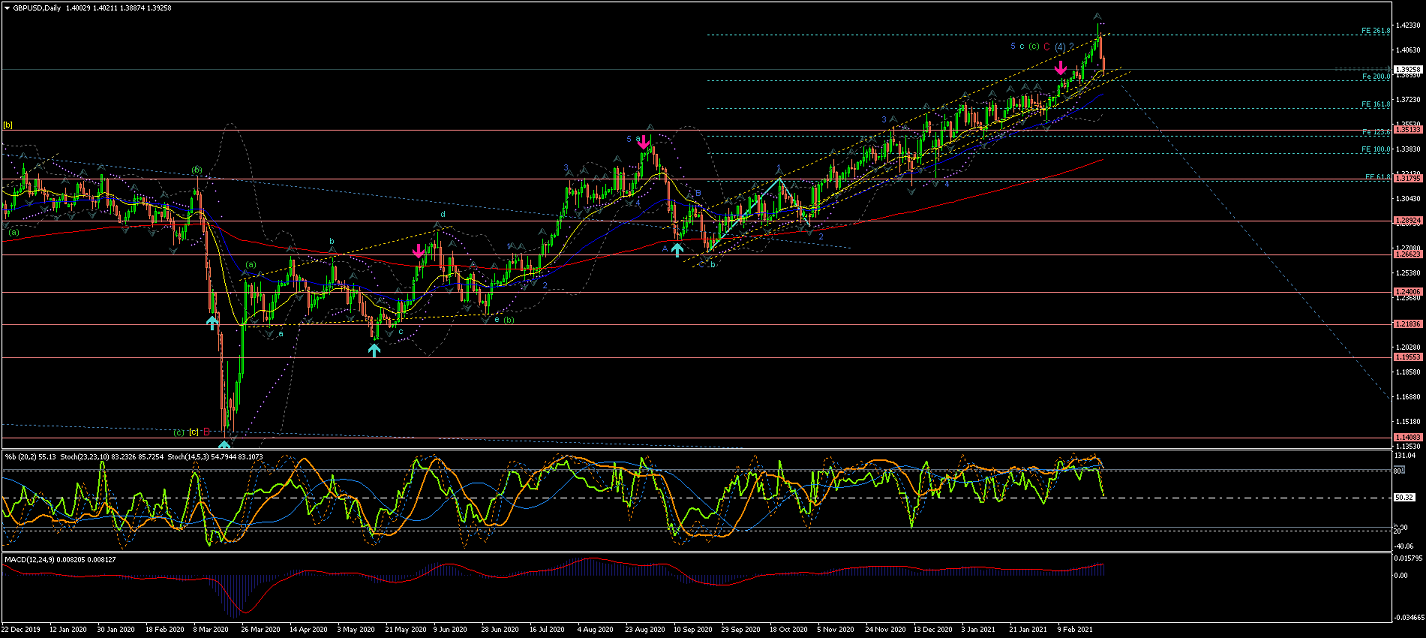
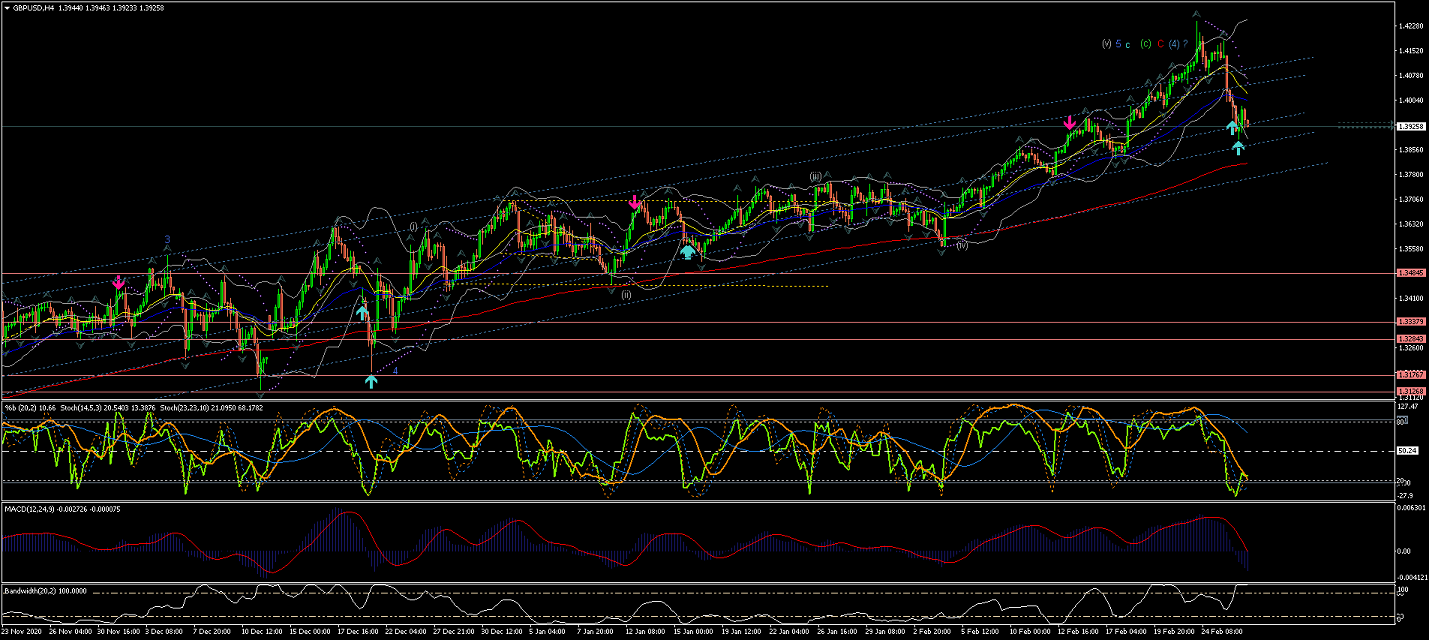
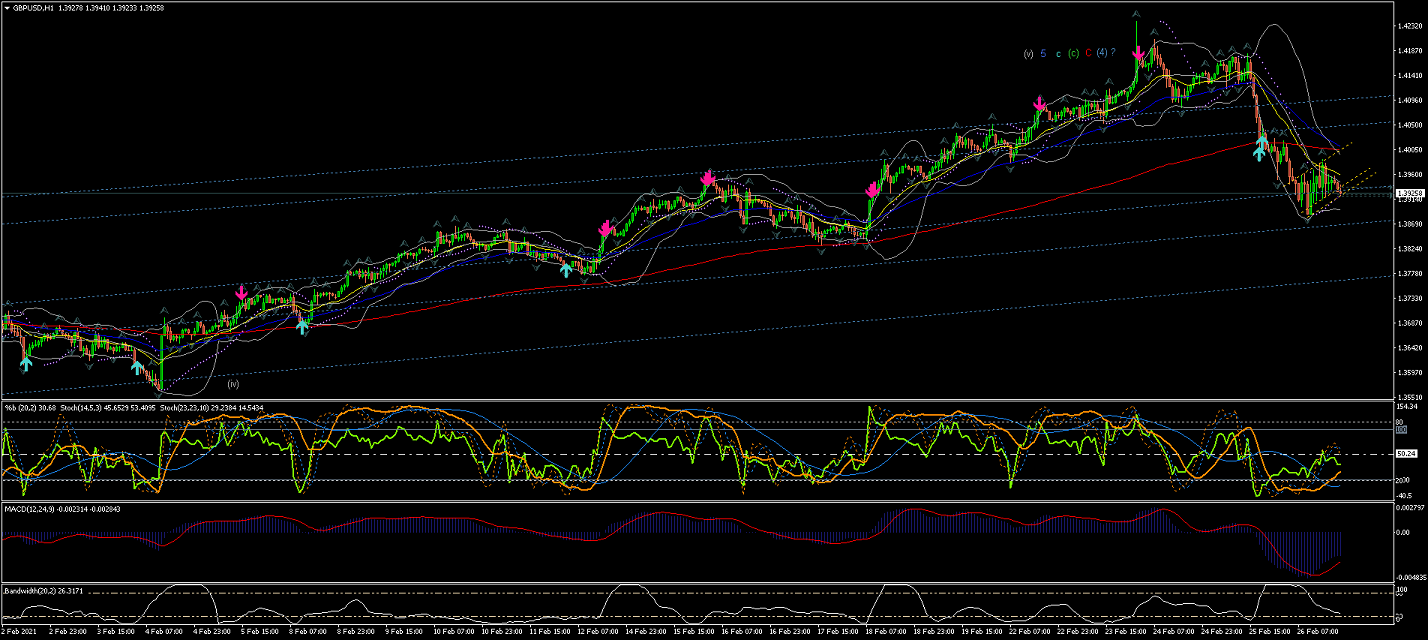
GBPUSD
Weekly chart shows an extended Wave (4) correction crossing the 200EMA in a rather struggling but consistent way...
At the current resistance points the price could start coming down lower to start Wave (5)
or continue higher as Alternate #1 suggests...
Regardless of the direction, the moves look rather weak than impulsive...
(Note Alternate #1 for a possible larger Wave (4) developing across the 200EMA).
Daily Chart is showing the Wave C(red) completing Wave (4) in what should then be a false breakout
of this long term triangle formation (blue long-term trendline).
If this is a false breakout the moves could start bringing the price down impulsively if it re-enters the blue long-term trendline.
Next, if this count is correct, we should expect the price to continue the moves down impulsively for Wave (5)...
But the price still needs to breakout of the current tight Ascending Range formation (yellow) and cross the EMAs...
4Hour Chart shows Wave (4) correction extended and forming an extended last Wave 5(blue) within the current Range formation(blue)...
Next, I would wait for the price to confirm the start of Wave (5), before committing to short positions.
(i.e. breaking current Market Structure (blue trendline) and EMAs to the downside)
60Min Chart is showing the price starting to show impulsive waves to the downside, although still within the current (blue) Range formation...
Watch for further moves to the downside, which could lead to opportunities for further moves downwards, as per current count...
All the best for everyone and please do not hesitate to contact me if you have any questions or comments.
Andres
info@tradingwaves.org
Please be aware: that these Analysis are own opinions, not Trading advice; Trading carries a high level of risk, and may not be suitable for all investors. Before deciding to trade you should carefully consider your investment objectives, level of experience, and risk appetite.


 Trading Waves .org