Fri 09-10-2020
Hi everyone, hope you are all great.
Let's get into it...
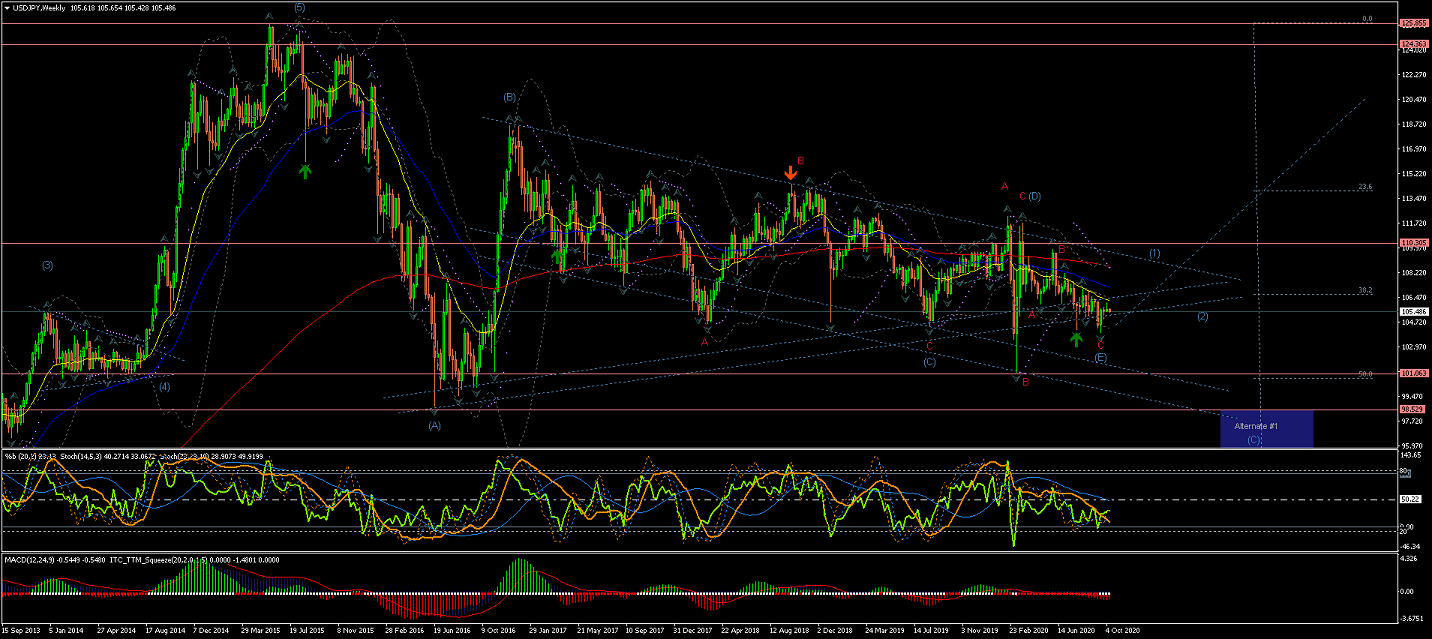
USDJPY
Weekly Chart is showing a quick raise in Wave C(red) to complete Wave (D), seems like another drop for Wave (E) has targeted
the lower triangle trendline, to complete this long term correction... Although we need to be aware of possible further extension to the downside.
A breakout of this long-term triangle to the upside, after the this long-term correction, under the current count,
would suggest the beginning of the start of Wave (1) of a long-term raise.
(a drop across the %50 retracement would favor Alternate #1 count for an extended Wave (C) correction towards the %62)
Daily Chart is showing the current Wave (E) might have been completed within a descending channel.
(where Waves A(red) and B(red) showed 3 internal waves and Wave C(red) shown 5 internal waves move
for an expanded flat correction)
However, the moves continue to be corrective in nature overall, and still below the EMAs, so I wouldn't start long positions yet,
but if the price continues higher and breaks through the upper trendline of the current range
it would increase substantially the probabilities of the start of the new trend up described in the Weekly Chart.
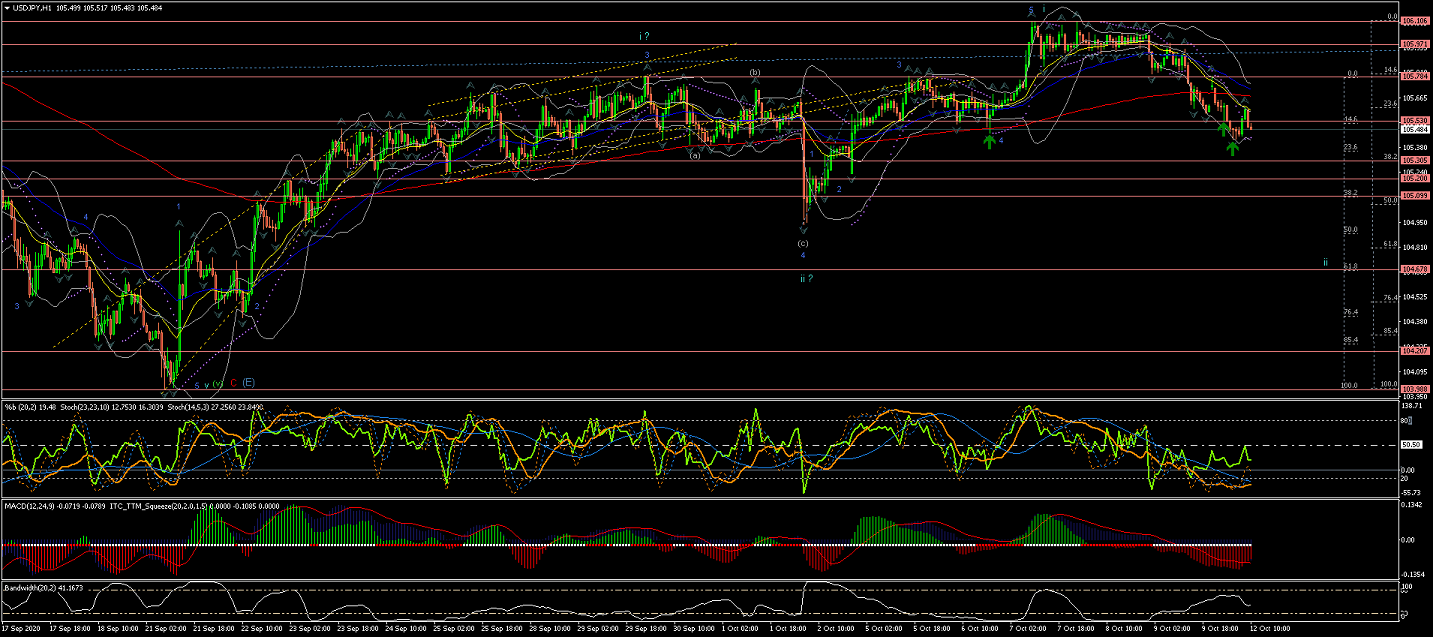
4Hour Chart is pointing at the price starting the initial Wave i up and its corrective Wave ii now underway.
(note how I corrected previous count for largers Waves i and ii and left previous count as alternative instead)
Next; watch for Wave ii to bring the price down towards lower retracement areas in a corrective manner
(typically around %62 retracement) before Wave iii starts taking the price up again impulsively.
60Min Chart shows the internal waves of Wave i might already completed.
(notice the corrected counts for Waves i and ii)
Now, Wave ii broke the Market Structure heading below the 200EMA and possibly still heading lower until
the price picks up momentum to continue the moves up with Wave iii.
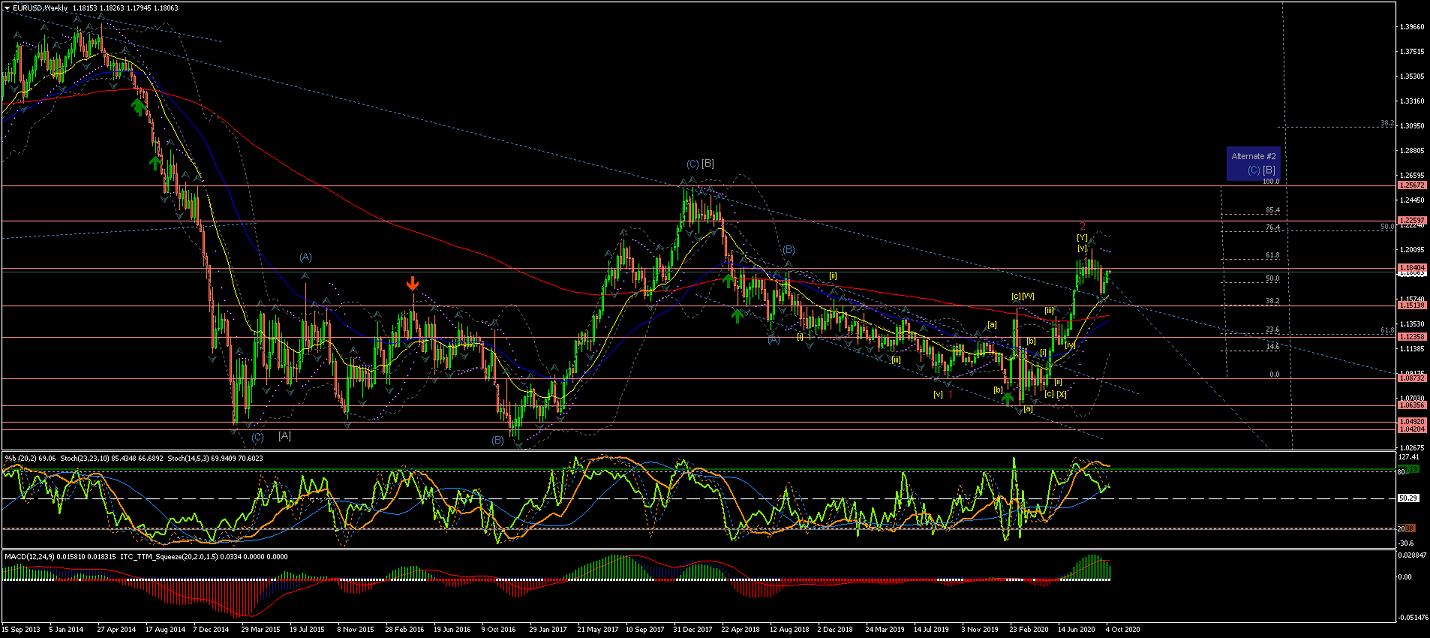
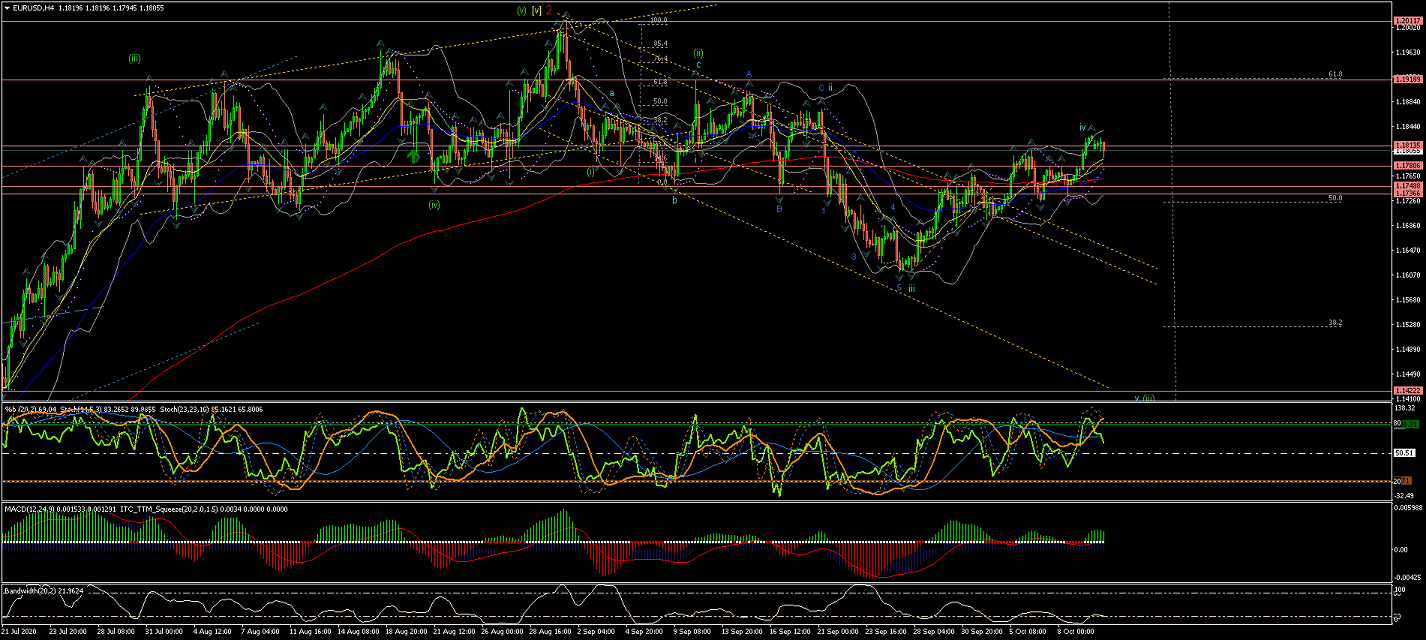
EURUSD
Weekly Chart is showing an extended Wave 2(red) now hanging around the %62 retracement of Wave 1(red).
Notice the Alternate #2 for more extensive correction of long-term Wave [B] to have in mind.
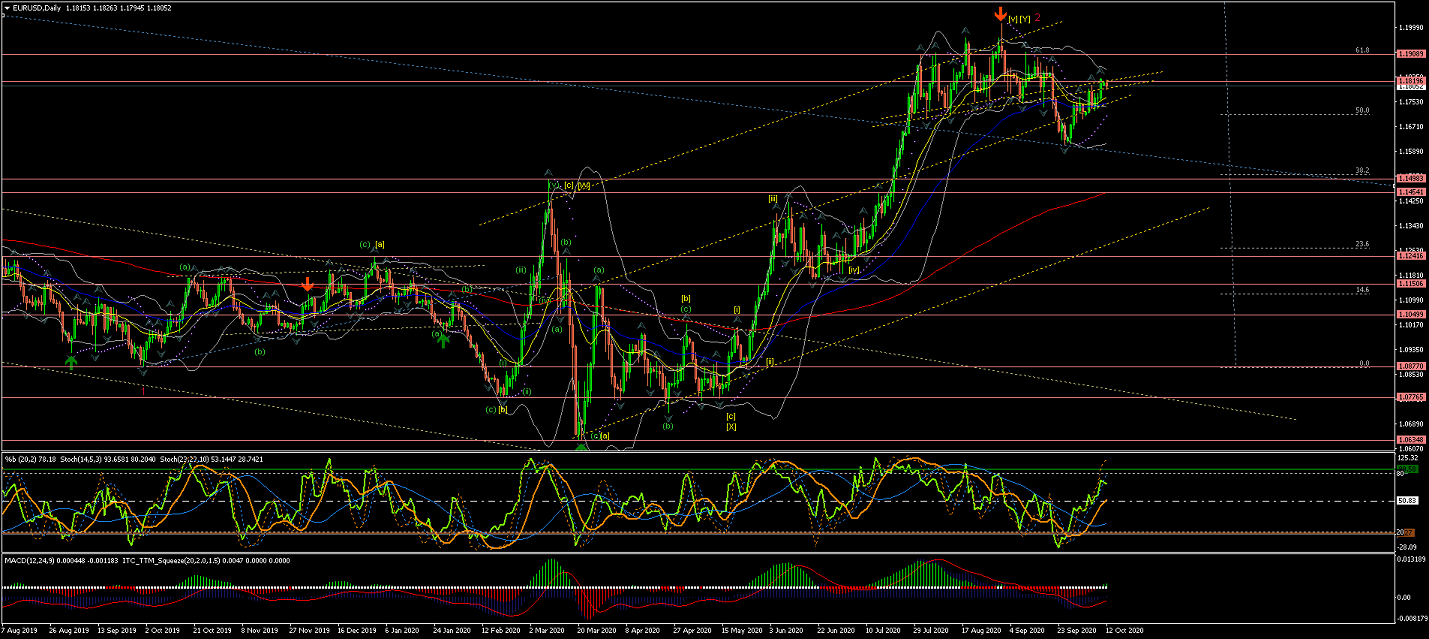
Daily Chart is showing Wave 2(red) reaching the %62 retracement in the form of 5 waves
to make for an extended Flat correction, as it broke out of the internal Range and now is above the upper side of the long-term triangle formation.
Next, I would expect signs for the start of Wave 3(red) to continue the impulsive waves down, which have already confirmed a change of the previous Market Structure to the downside that could be aiming to the 200EMA...
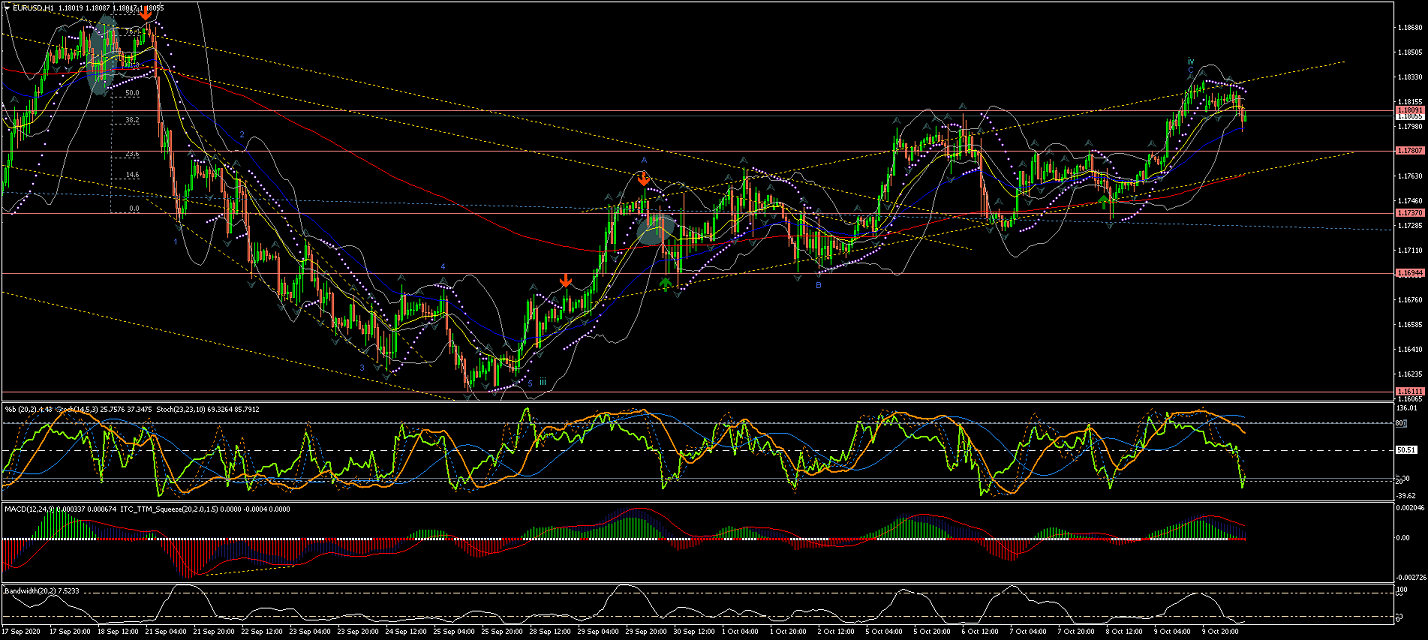
4Hour Chart is showing the current market structure creating lower highs and lower lows...
And the latest price drop looks to have confirmed Wave (iii) on the way down.
Within the latest move down the price has created a Range where the latest low could be the completion of Wave iii of Wave (iii)
And the raise breaking the upper trendline of this range could have topped Wave 4(blue)...
If this count is correct we should expect Wave v to bring the price down below the EMAs again.
60Min Chart is showing Wave iv of Wave (iii) completed at the upper trendline of new range formation.
If the price starts moving down impulsively towards the lower trendline and breaks the latest range to the downside
it would confirm Wave 5(blue) but any further move up from the upper trendline would invalidate the current count.
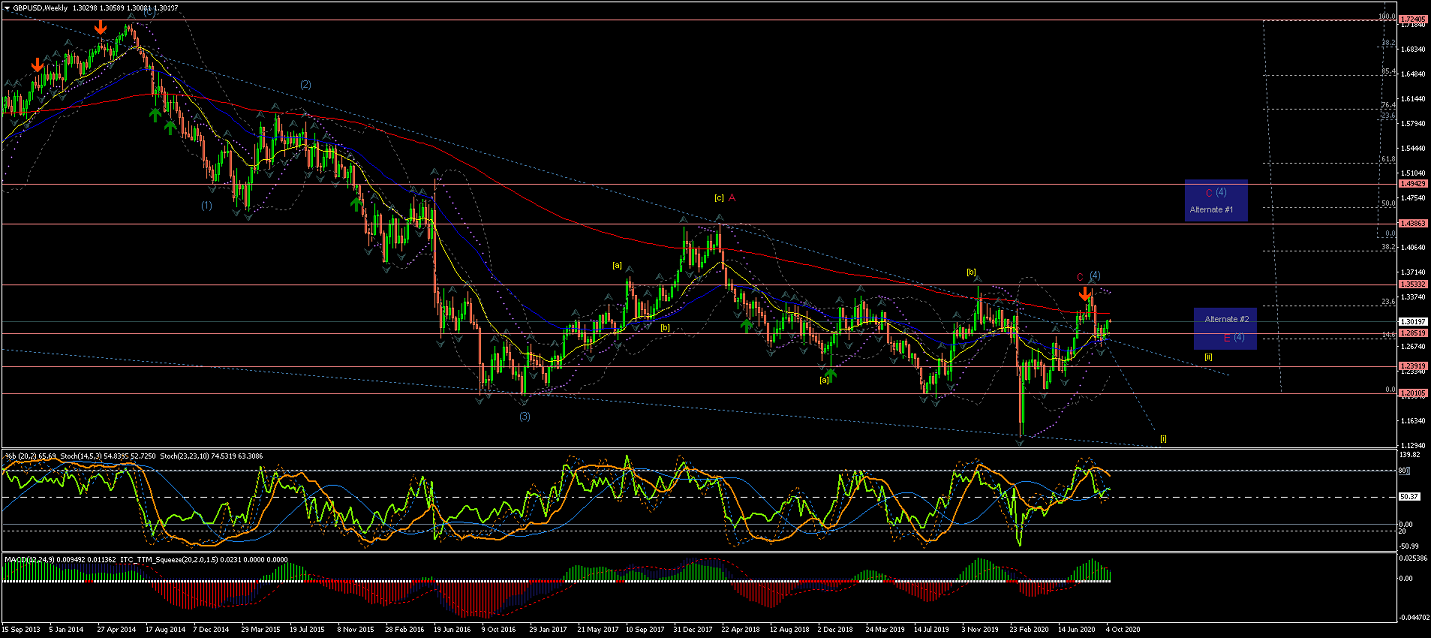
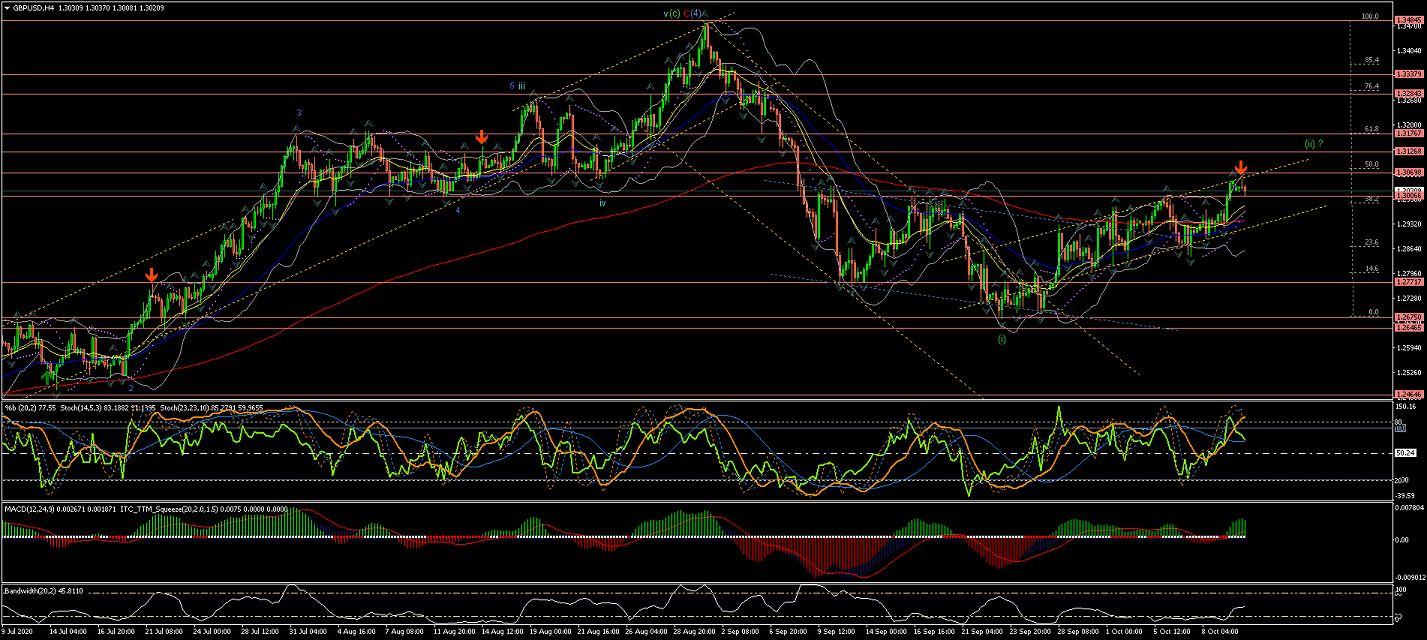
GBPUSD
Weekly chart shows the updated count for an extended Wave (4) correction hitting and rejecting strongly the 200EMA to
potentially put an end to this correction rally.
At this point the price could start coming down lower to start Wave (5) or continue higher as Alternate #1 suggests.
(Note Alternate #1 for a possible larger Wave (4) developing across the 200EMA).
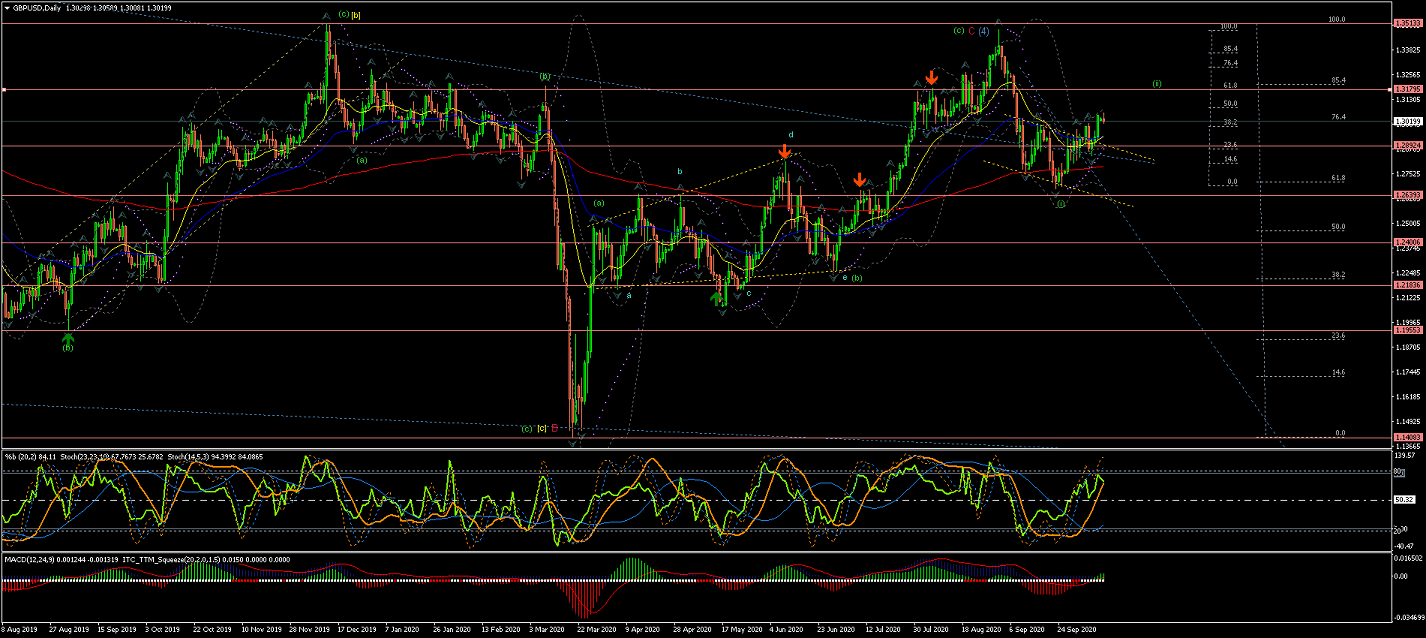
Daily Chart is showing the Wave C(red) completing Wave (4) in what should then be a false breakout
of this long term triangle formation.
Next, if this count is correct, we should expect the price to continue the moves down impulsively for Wave (5) towards
the lower trendline (blue).
4Hour Chart shows the internal waves of the last leg of Wave (4) completed.
So next, as per current count expected, the price dropped forming series of 5 waves down crossing through the EMAs.
A break of the previous Market Structure has confirmed the new Trend down (lower highs and lower lows)
forming an initial Wave (i) and could have completed Wave (ii) at nearly %50 retracement of Wave (i)
Be aware of the price now sitting on top of the EMAs, which could suggest the price to still push up towards higher retracement areas.
Next, I would wait for the price to break the current market structure and fall below the EMAs, breaking ther current range to the downside
before committing to short positions and see probabilities of the start of Wave (iii).
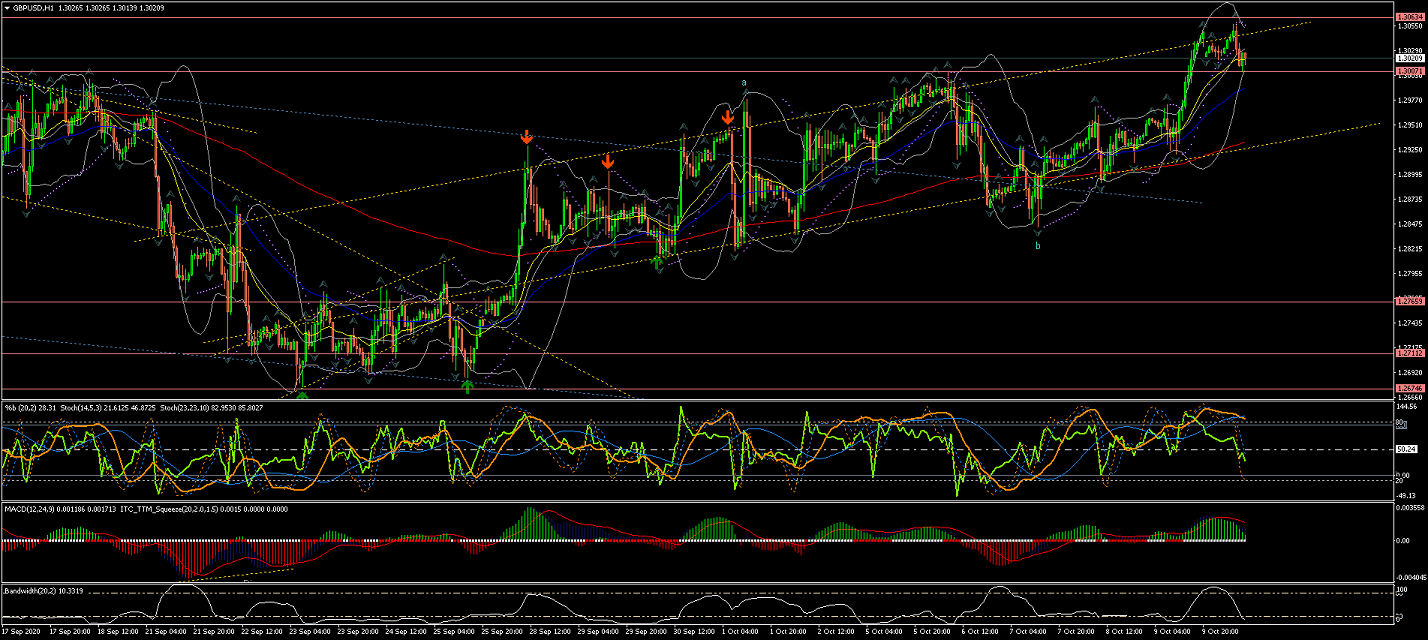
60Min Chart is showing Wave ii still pushing the upper trendline of this range and respecting the EMAs.
So, as mentioned earlier, I wouldn't see signs of Wave (iii) start probabilities until the price breaks through the EMAs and lower trendline
All the best for everyone and please do not hesitate to contact me if you have any questions or comments.
Andres
info@tradingwaves.org
Please be aware: that these Analysis are own opinions, not Trading advice; Trading carries a high level of risk, and may not be suitable for all investors. Before deciding to trade you should carefully consider your investment objectives, level of experience, and risk appetite.


 Trading Waves .org