Fri 05-06-2020
Hi everyone, hope you are all ok.
Let's get into it...
USDJPY
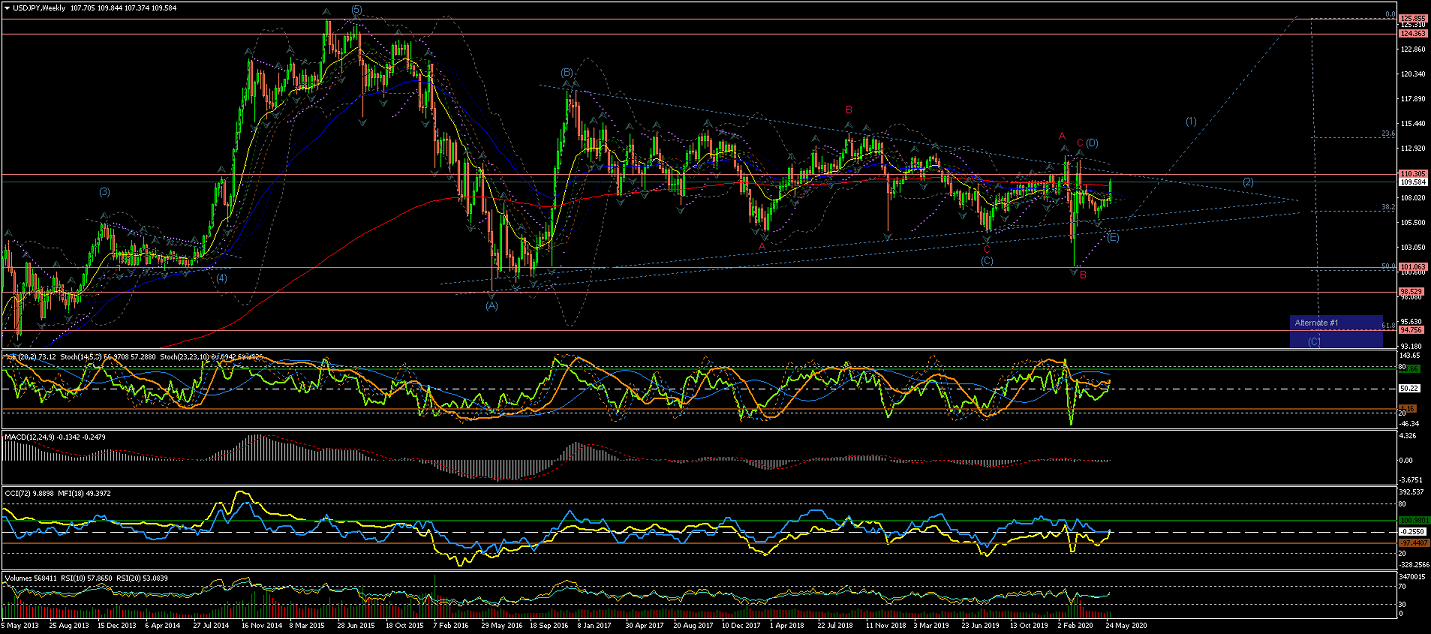
Weekly Chart is showing how a completed Wave B of (D) has, again, reached the %50 retracement of
the 5 waves raised upto year 2015;
And, after a quick raise in Wave C(red) to complete Wave (D), seems like another drop for Wave (E) should target
the lower trendline to complete this long term correction (or might have already done so).
A breakout of this long-term triangle, after the correction under the current count,
would suggest the beginning of the start of Wave (1) of a long-term raise.
(a drop across the %50 retracement would favor Alternate #1 count for an extended Wave (C) correction towards the %62)
Daily Chart is showing Wave (D) completed, with a extremely quick drop and an equally
quick rise.
The current Wave (E) seems already completed its internal Waves [a] and [c],
although left Alternate #2 for the possibility of an extended Wave [b] and [c].
As per current count, expect the price to continue to raise to form Wave [i] of Wave (1) up...
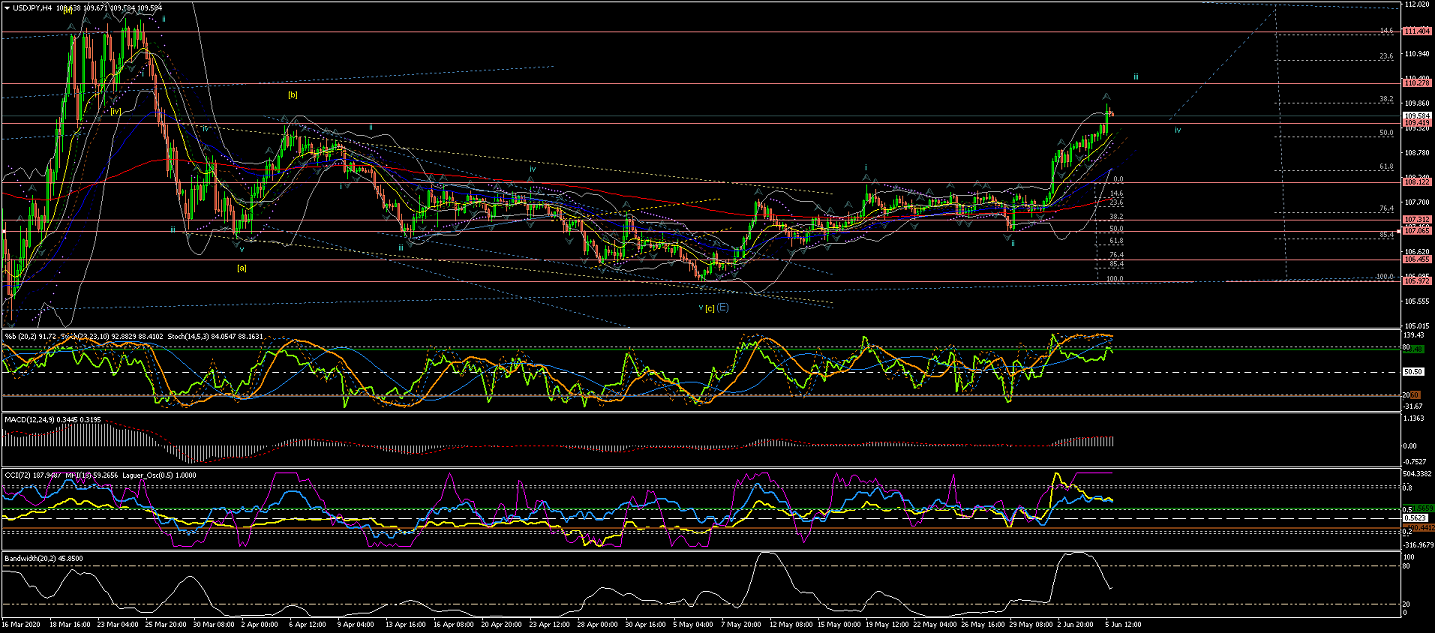
4Hour Chart showing more in detail the internal waves of Wave (E) completed and the current Waves i and ii also completed,
as the price continues to raise following Wave iii.
Next, expect Wave iii to confirm its completion, to give turn for Wave iv correction.
While, at this point 108.122 should hold the price (as the highest of Wave i)
until Wave [i] is completed to at least the upper trend.
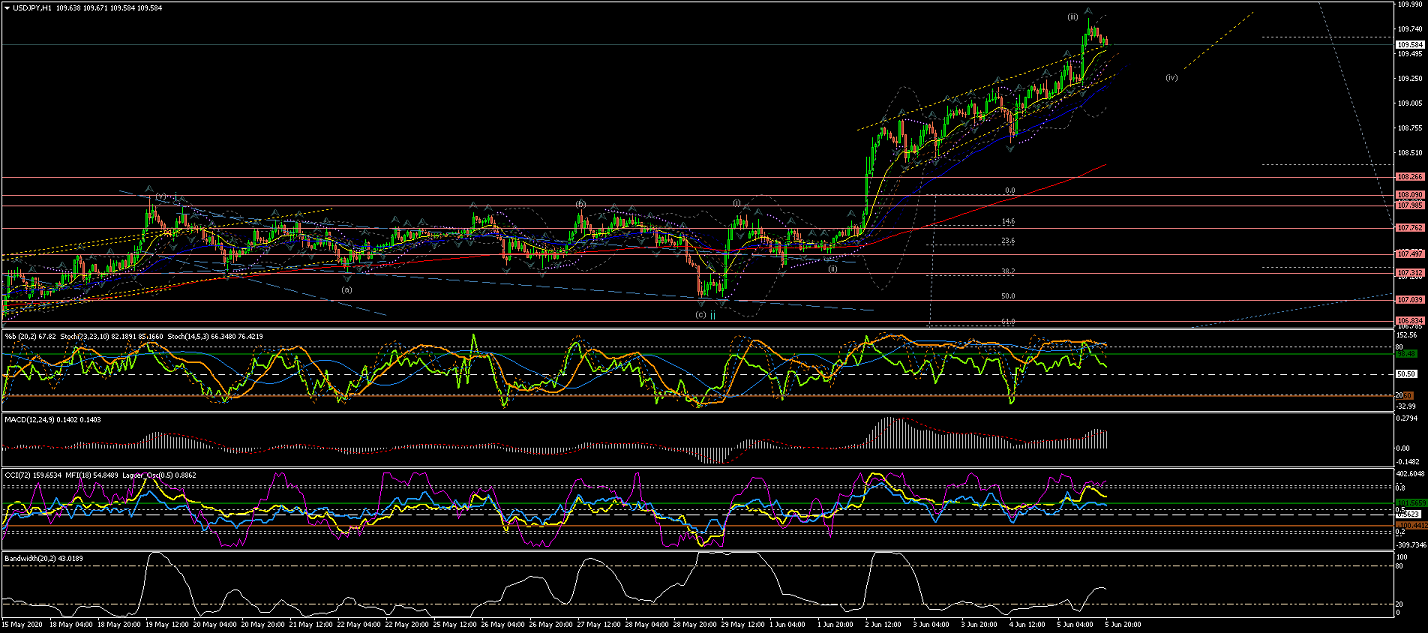
60Min Chart shows in even more detail the internal waves of Wave iii still developing;
With Wave (iii) possibly completed, and Wave (iv) correction to take place before Wave (v)
completes Wave iii at the next big resistance around the 110.278 area.
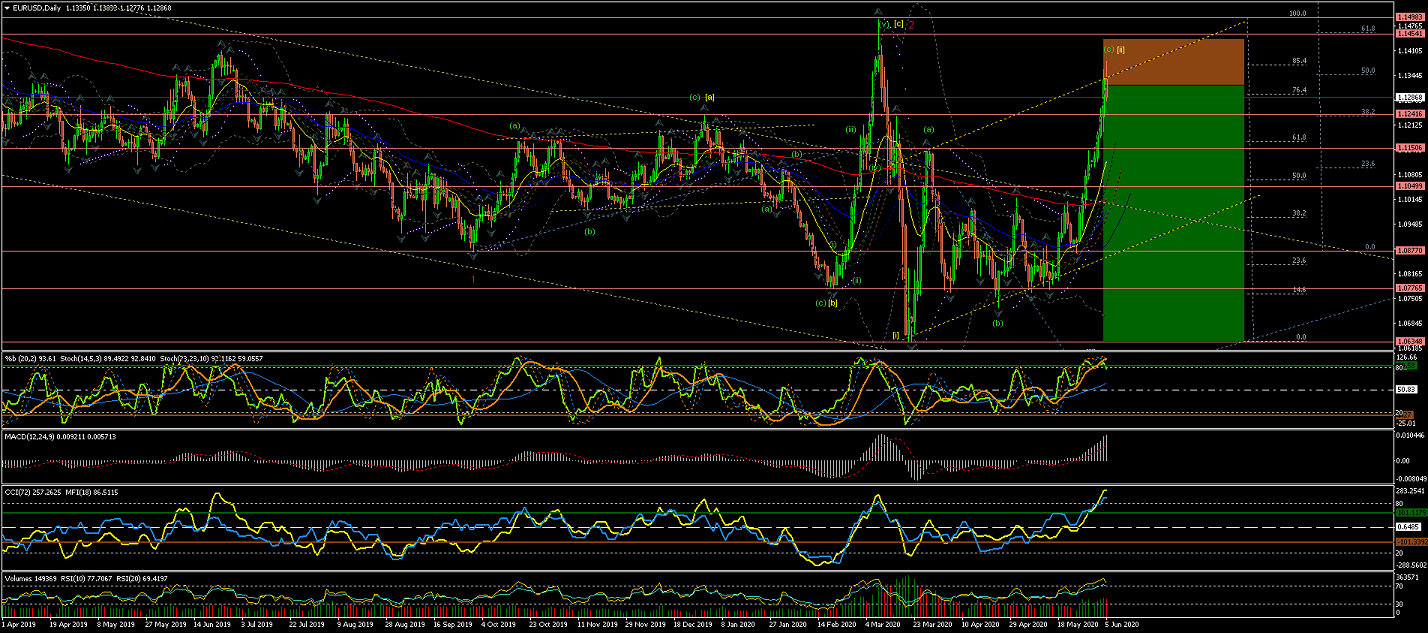
EURUSD
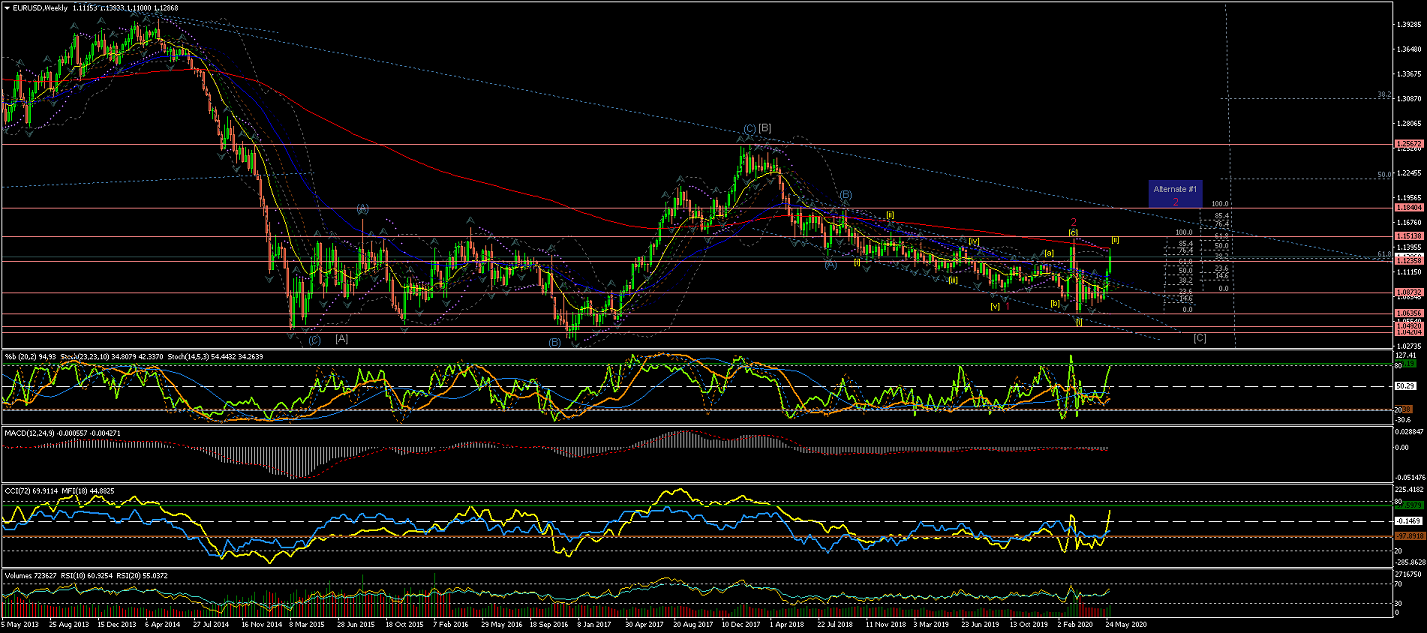
Weekly Chart, under the current interpretation,
shows a Wave 2(red) crossing slightly over the %62 retracement of Wave 1(red)
and now an extended Wave [ii] could be completed at the 200EMA and %85 retracement of Wave [i] of Wave 3(red).
Notice the Alternate count #1 & for an alternative more extensive correction of Wave 1 (red) to have in mind.
Daily Chart is showing Wave [ii] making an extended correction
and retracing at the %85 retracement level, as the top of the current range formation.
Further impulsive waves down will give more weight to the current count for Wave [iii] start,
and, hence, a start for a long move to the downside.
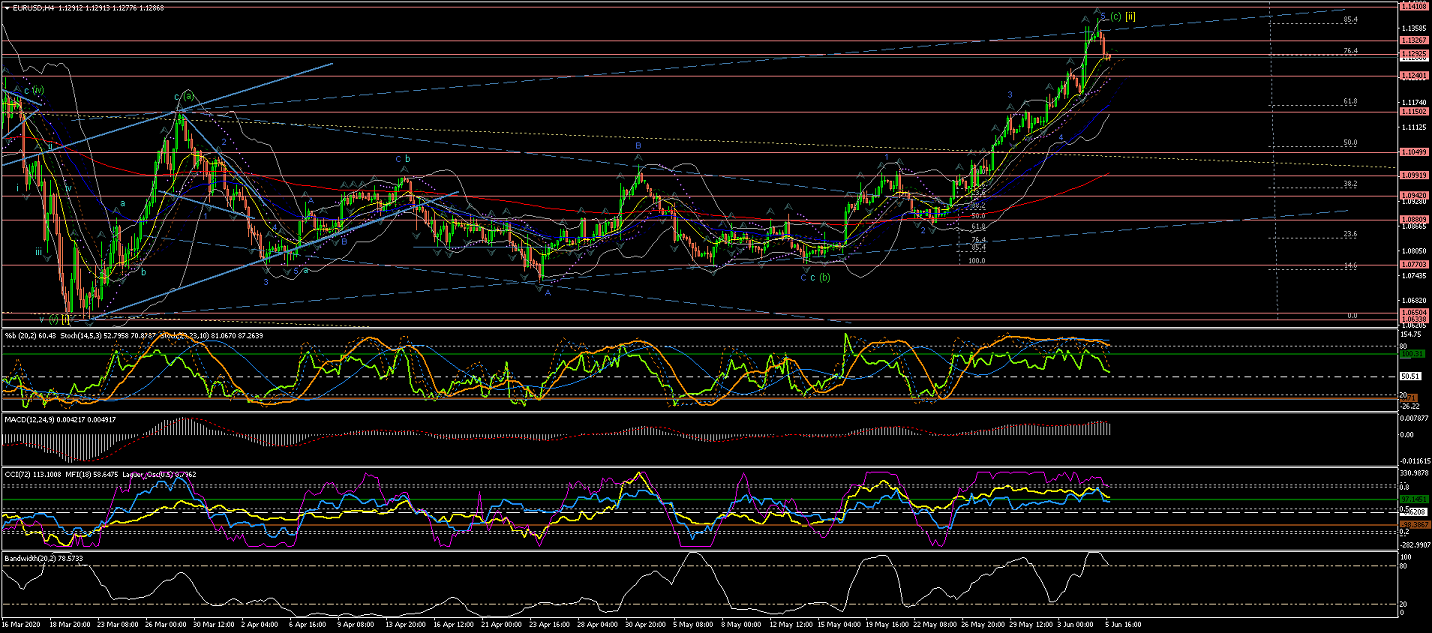
4Hour Chart is showing Wave [ii] correction possibly completed at the upper trendline,
And a clear rejection from this trenline that indicates o probable start of Wave [iii].
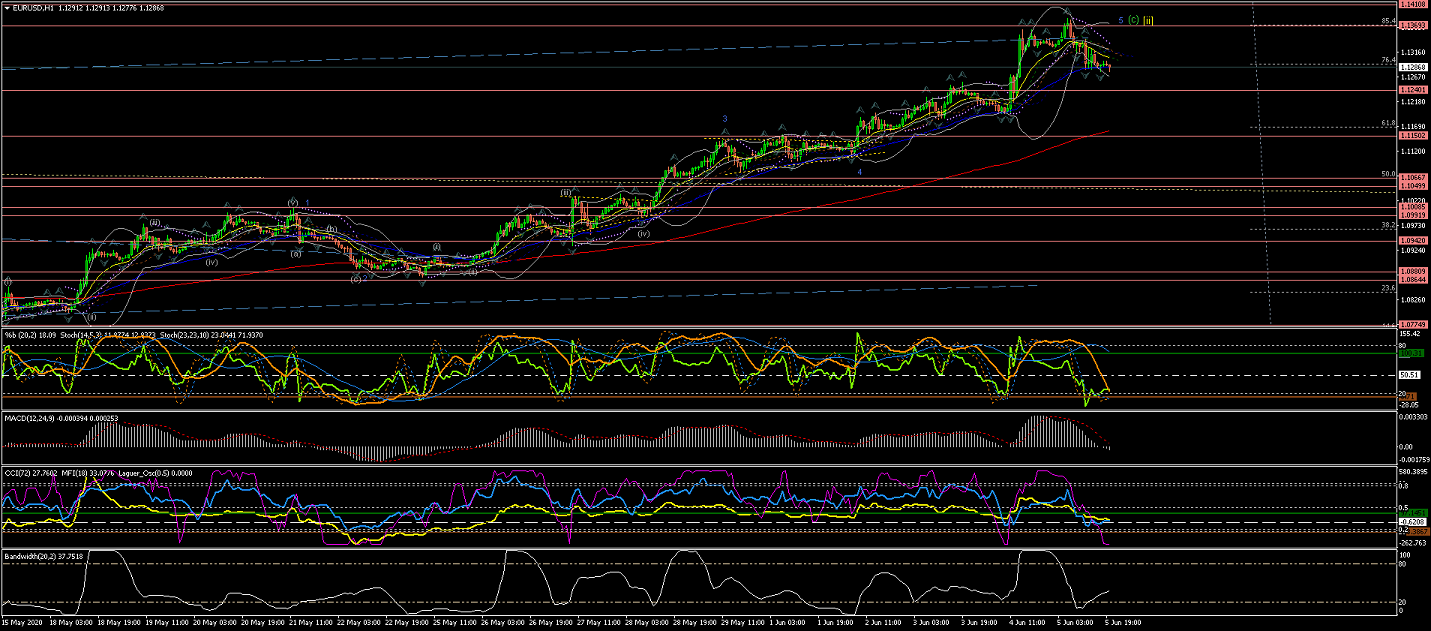
60Min Chart is showing the internal Waves of Wave [ii] possibly completed.
Next, expect impulsive moves to the downside to confirm the start of Wave [iii]
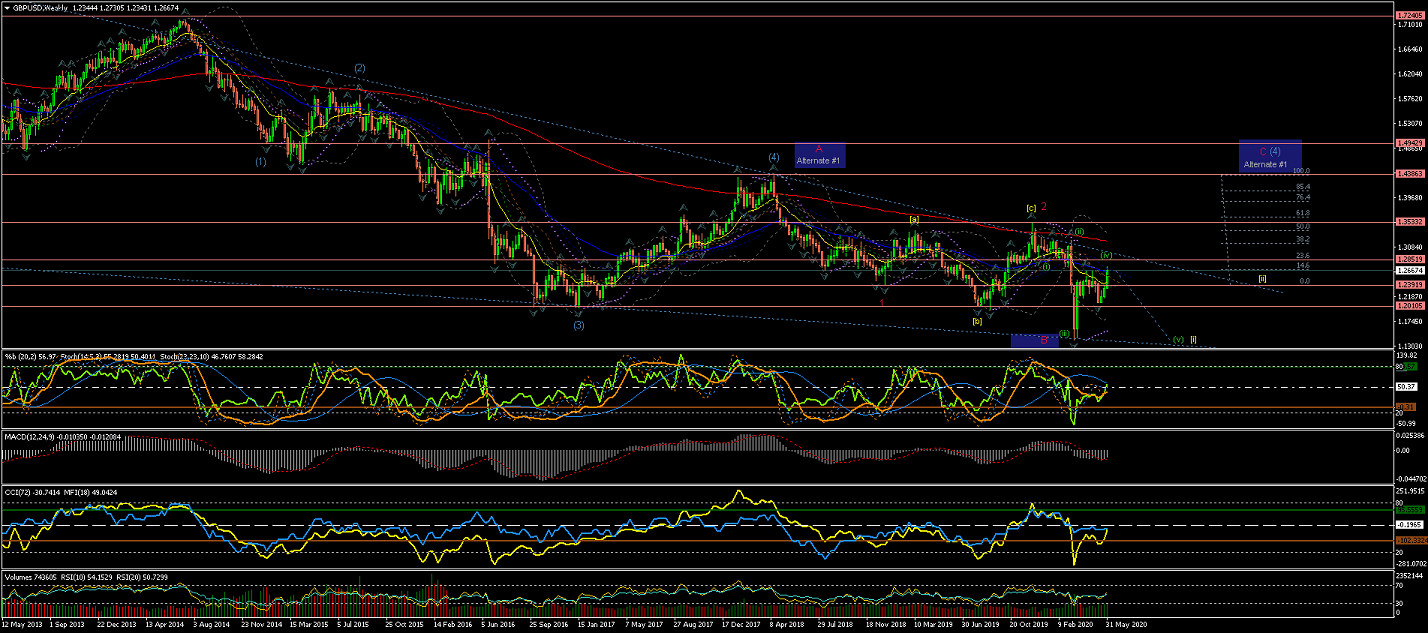
GBPUSD
Weekly chart shows Wave 1(red) and a Wave 2(red) correction completed at the 200EMA level with a retracement
between %50 and %62 level.
From there the price showed an impulsive move down that was rejected by the lower trendline;
A move that suggest the initial waves of Wave [i] of Wave 3(red) starting to develop.
Note Alternate #1 for a possible larger Wave (4) developing.
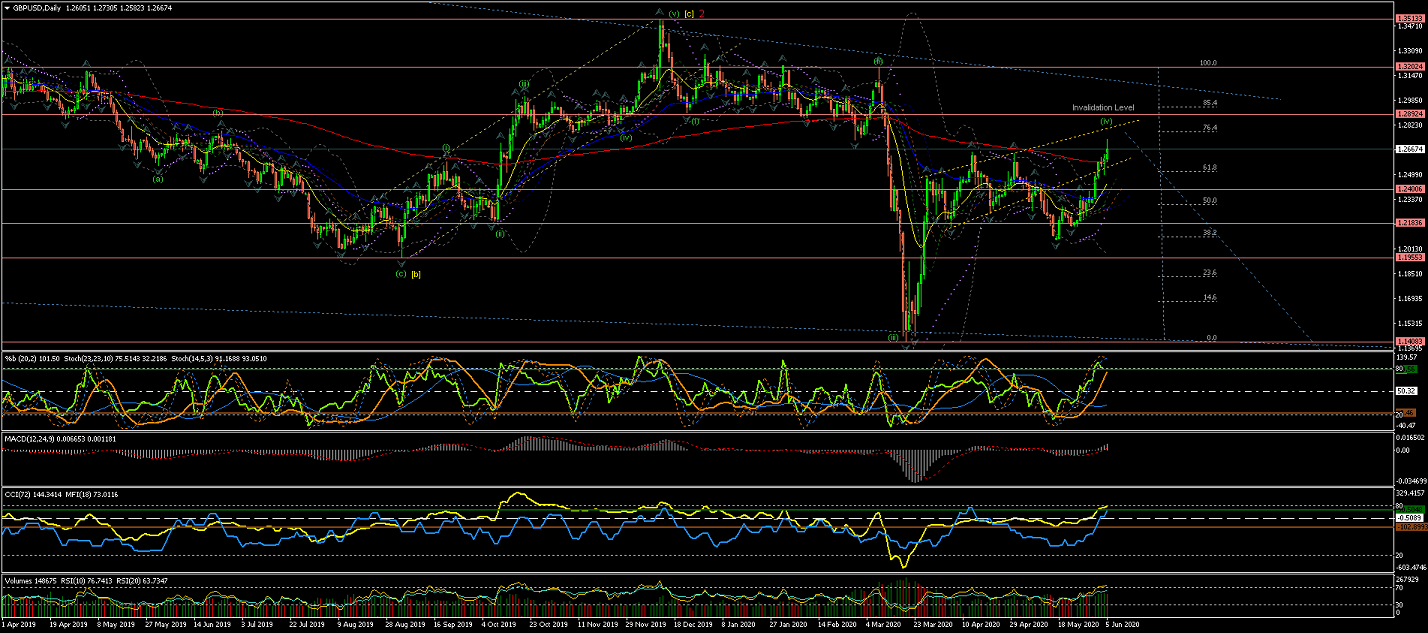
Daily Chart is showing the Wave (iii) (of Wave [i] of Wave 3(red)) completed in a sharp move down.
The rally afterwards looks like an odd lengthy Wave (iv) correction that has now reached, and almost touching,
the %76 retracement of Wave (iii);
(1.28900 area remains this count's Invalidation level - As the lowest of Wave (i)).
Next, we should expect, the price to move impulsively to the downside for Wave (v) to take place,
if this count is to remain valid.
4Hour Chart shows Wave (iv) nearly completed after an extension
that is coming really close to the count's Invalidation Level.
If the current count stands the test, expect the price to start moving impulsively
to the downside to the start of Wave (v)
60Min Chart shows the internal waves of Wave Y of Wave (iv) under development;
Running in its last internal Wave v for completion towards the upper range trendline (best pictured in the 4Hour Chart).
Next, once Wave (iv) is finally completed, the price should continue moving down impulsively to the downside.
All the best for everyone and please do not hesitate to contact me if you have any questions or comments.
Andres
info@tradingwaves.org


 Trading Waves .org