Tue 10-03-2020
Hi everyone, hope you are all ok.
Let's get into it...
USDJPY
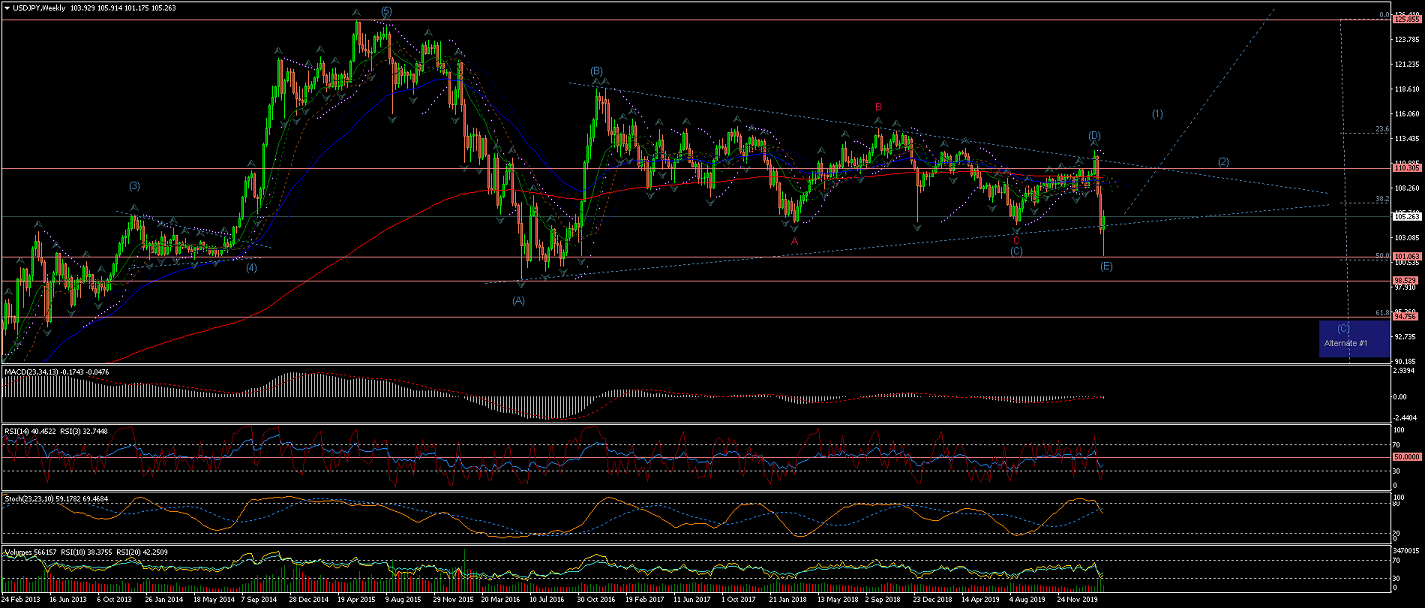
Weekly Chart is showing how previous Alternate #2 count has been triggered and Wave (E) has reached the %50 retracement of the 5 waves raised up to year 2015
The price has surged into the triangle formation again for the possible start of Wave (1) of a long raise.
Bearing in mind that;
* The Alternate#1 count for an extended Wave (C)
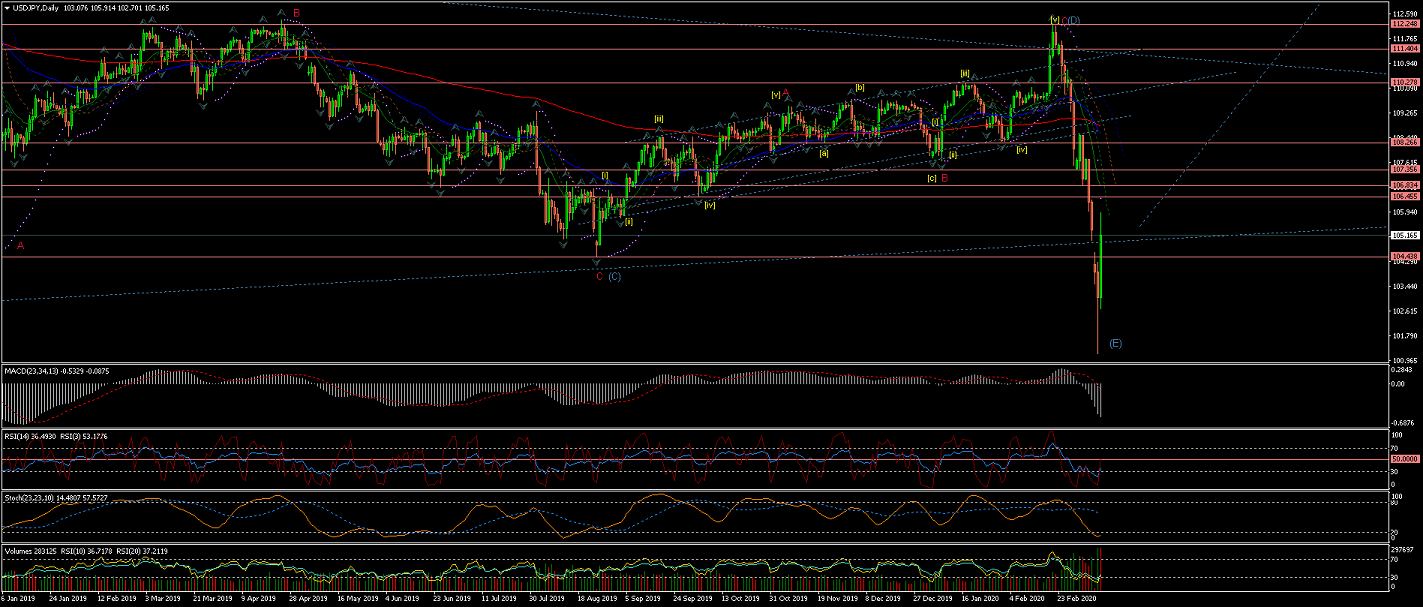
Daily Chart is showing the new count As Wave (E) completed with a extremely quick drop and a rise that followed up into the triangle again.
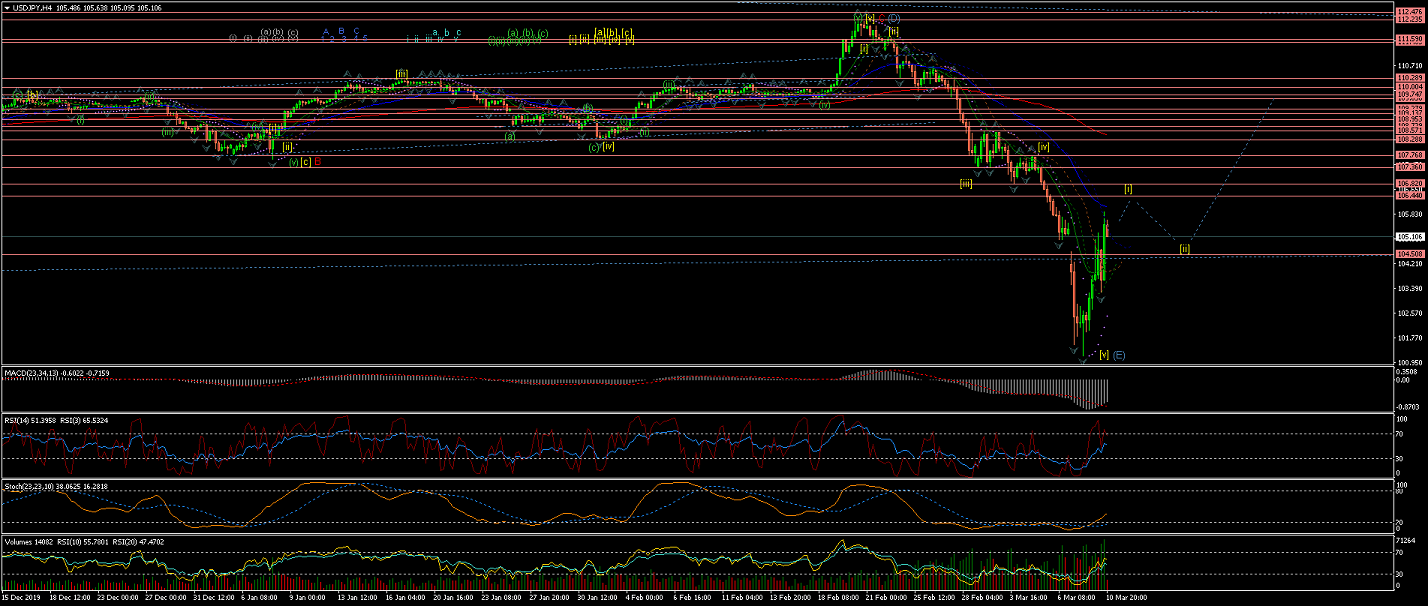
4Hour Chart shows the internal Waves' labels of Wave (E) and an almost completed Wave [i] for the possible raise of Wave (1).
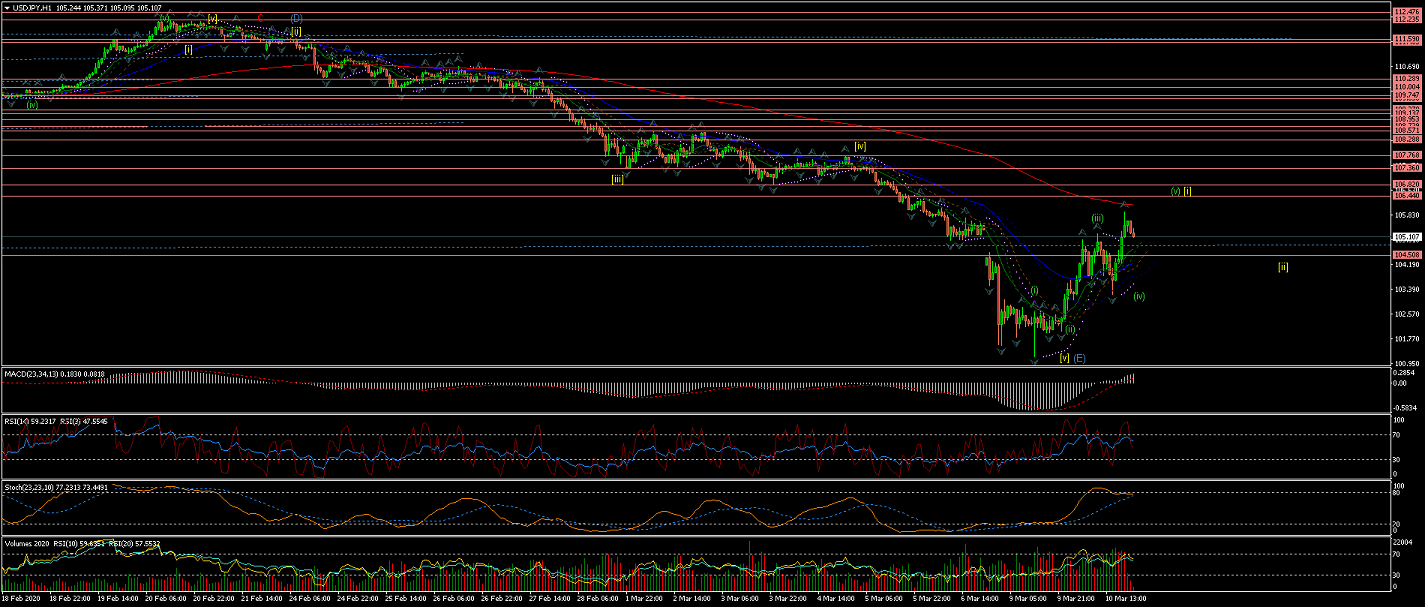
60Min Chart shows in more detail the 5 internal waves up of Wave [i] still under development.
EURUSD
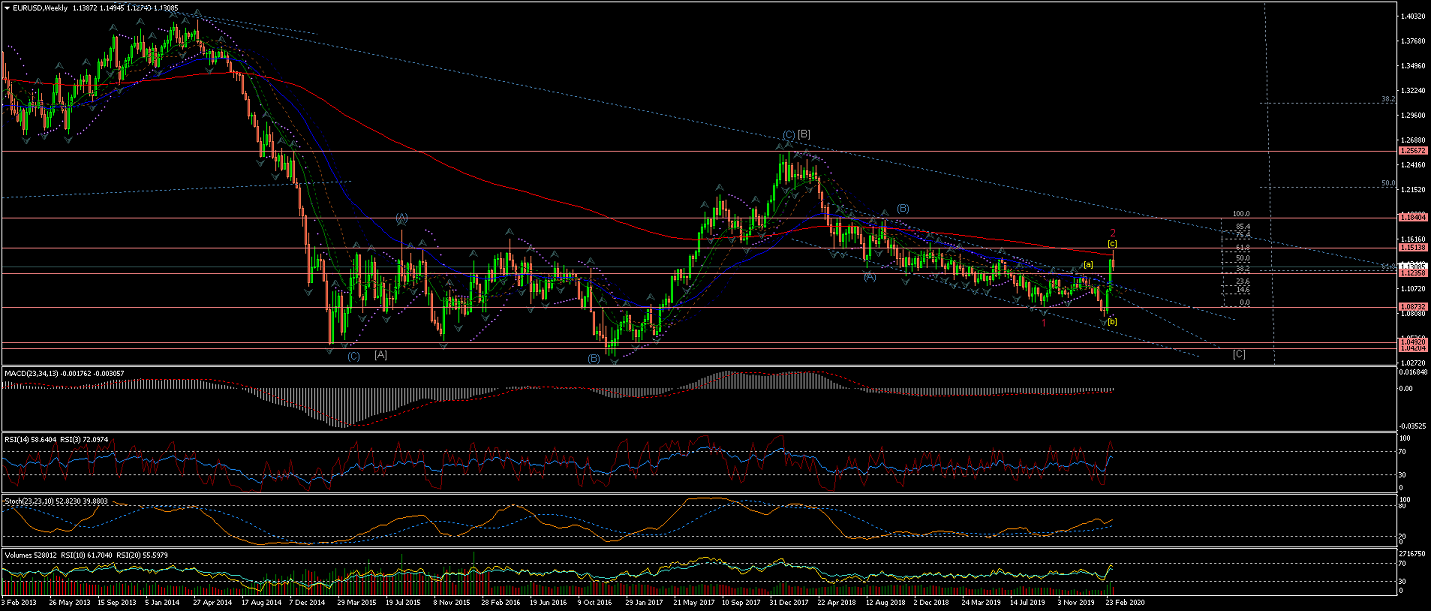
Weekly Chart, under the current interpretation, after triggering the previous Alternate Count,
shows a Wave 2(red) crossing slightly the %62 retracement of Wave 1(red)
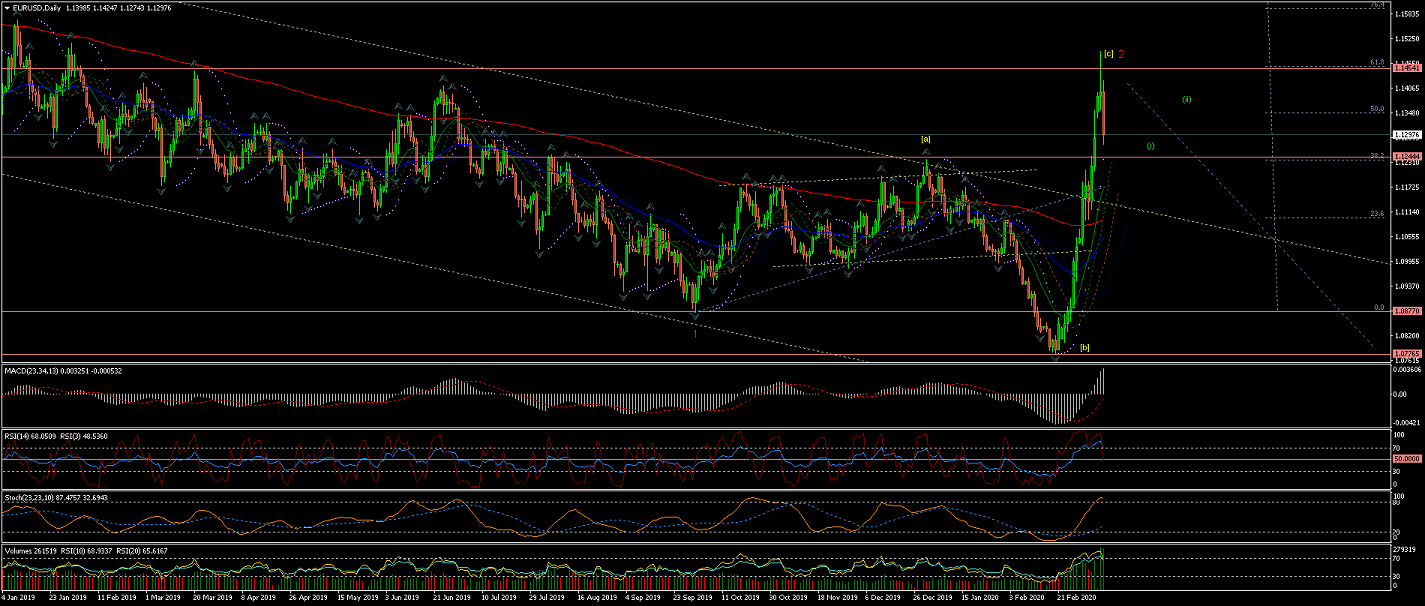
Daily Chart is showing Wave 2(red) possibly completed after a clear rejection at the %62 retracement.
An impulsive move down that suggest to be the initial Wave (i) of Wave [i] of Wave 3(red).
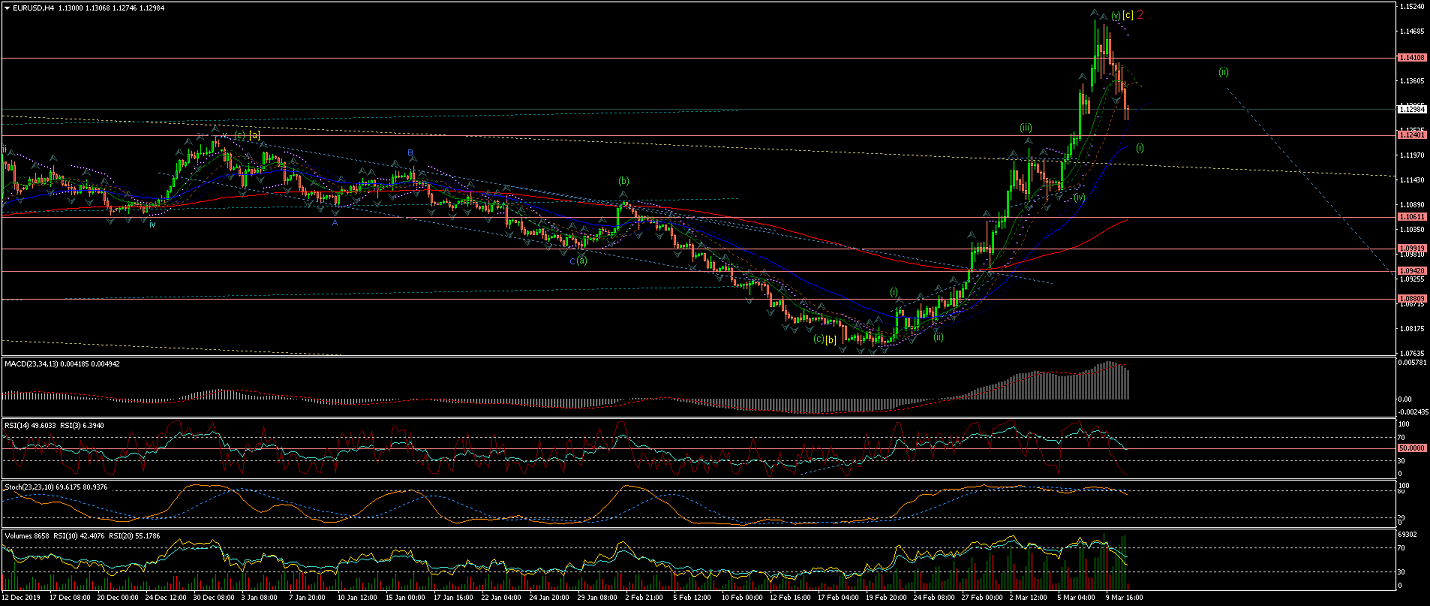
4Hour Chart is showing Wave (i) down still under development (possibly looking for a reversal for Wave (ii) at the 50EMA,
where there are some level of support from previous highs.
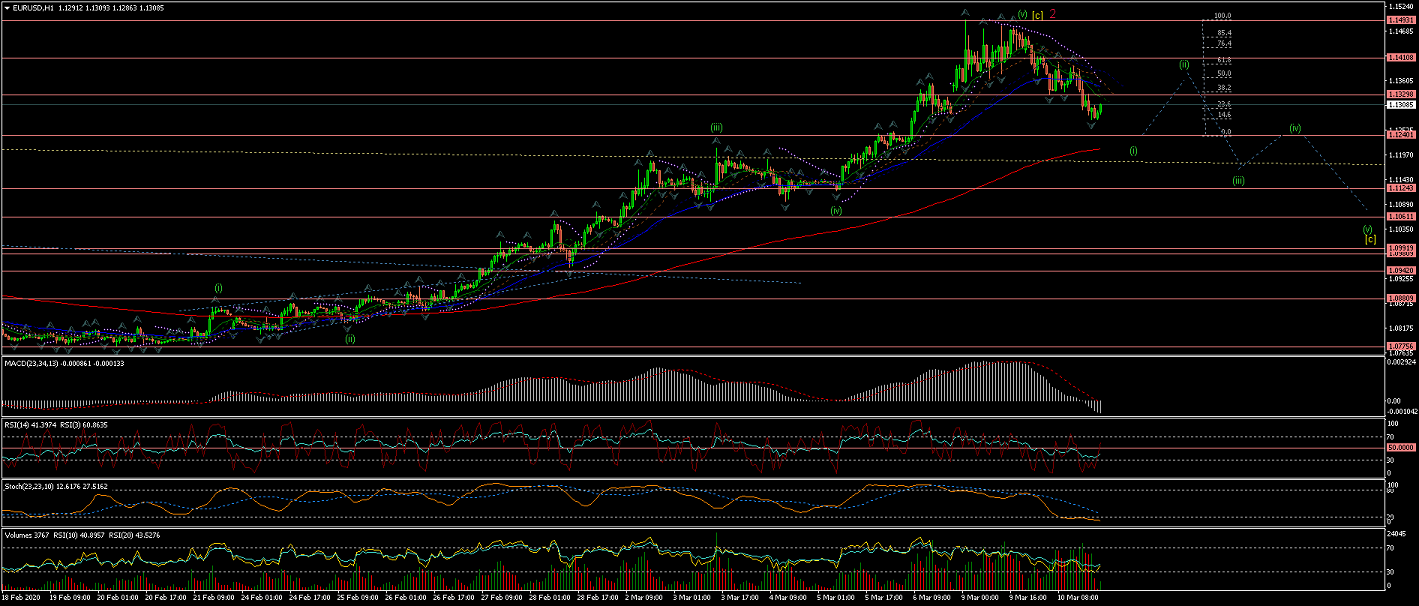
60Min Chart is showing the internal Waves of Wave (i);
And we should expect a raise for Wave (ii) correction in the next couple of sessions or so
before Wave (iii) brings the price down again.
GBPUSD
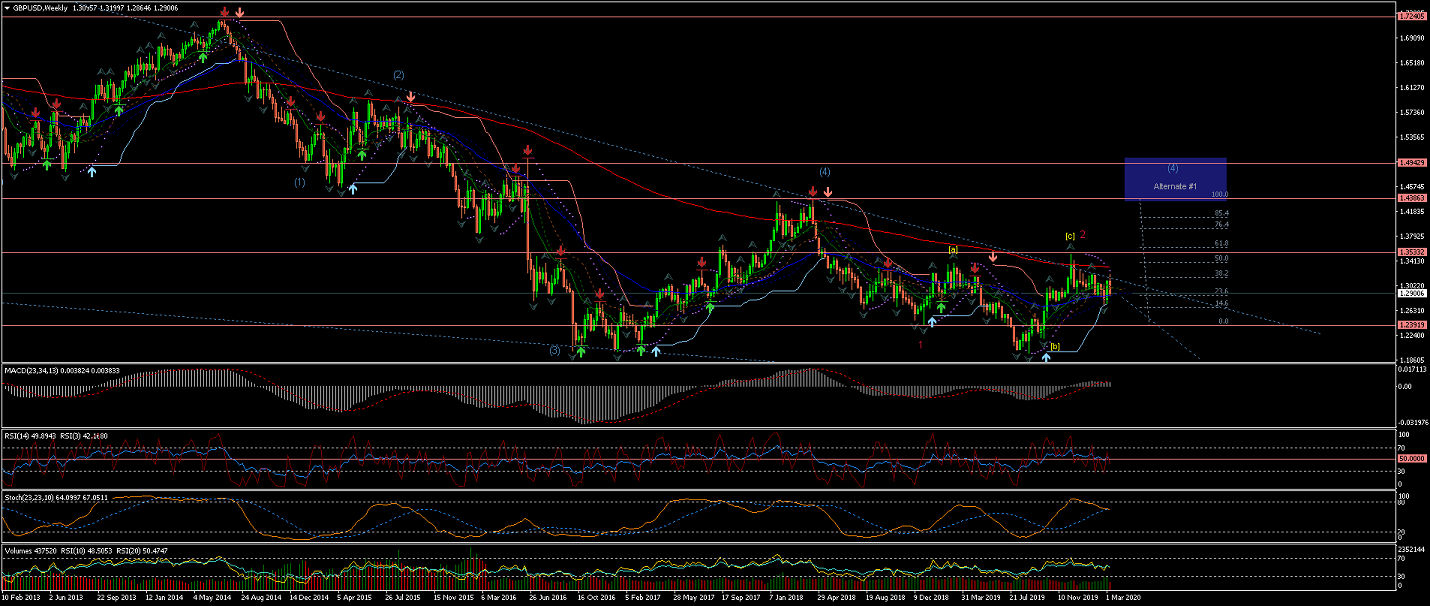
Weekly chart shows Wave 1(red) and a Wave 2(red) correction completed at the 200EMA level with a retracement between %50 and %62 level.
Note Alternate #1 for a larger Wave (4) developing.
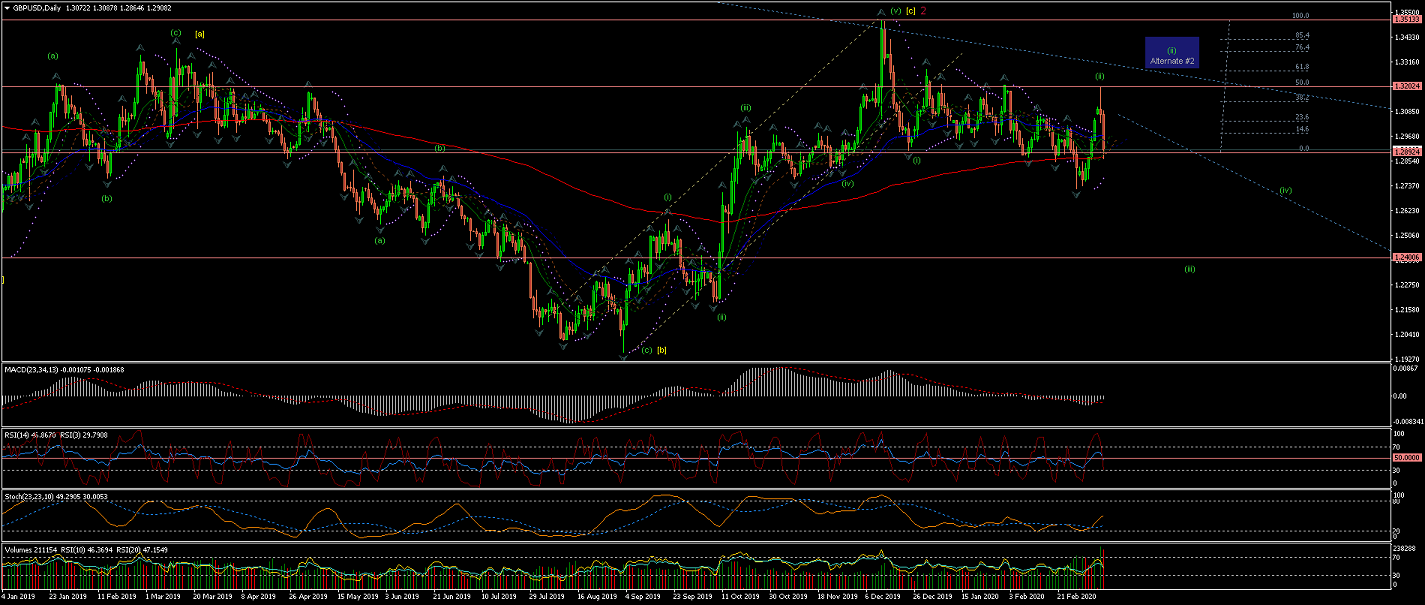
Daily Chart is showing the initials Wave (i) and Wave (ii) of Wave [i](yellow) (of Wave 3(red)) most likely completed
after an impulsive move down suggested the start of Wave (iii) down.
However, I have marked Alternate #2 for a possible extended Wave (ii) in the form of an expanded Flat correction.
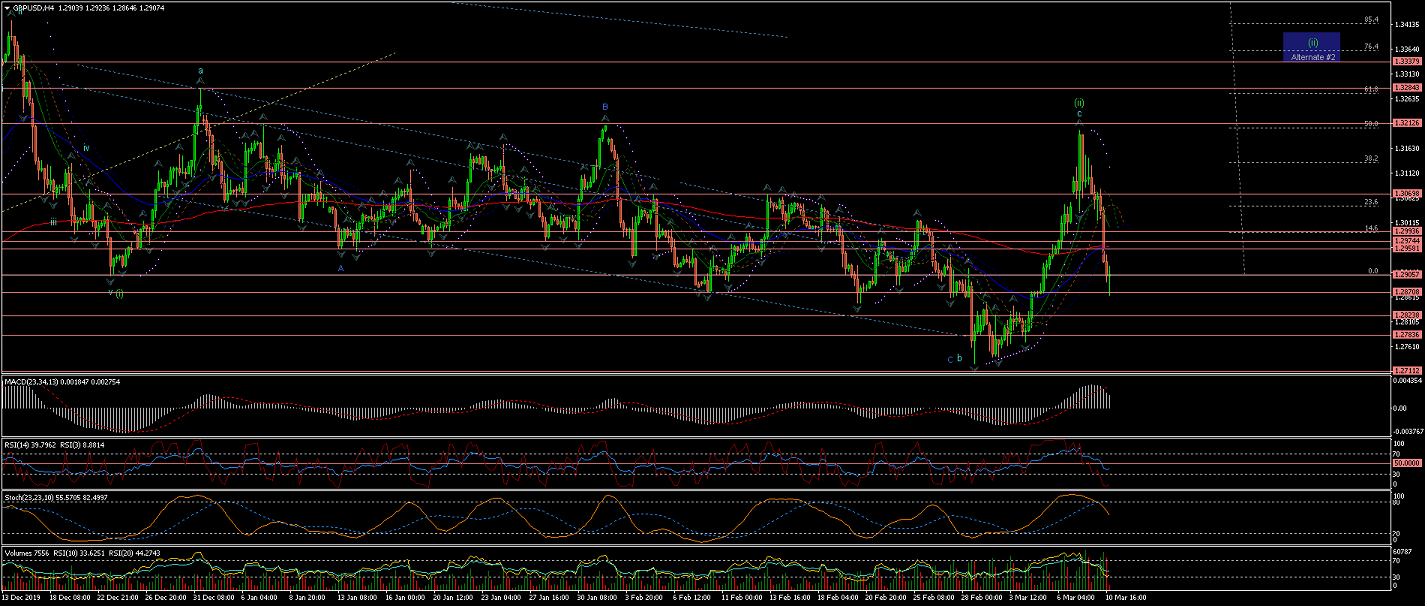
4Hour Chart shows an impulsive drop of the price back into the range area that has been stuck throughout the whole of Wave (ii)
If it crosses this series of resistance levels, after a correction, the move would be confirming Wave (iii) underway.
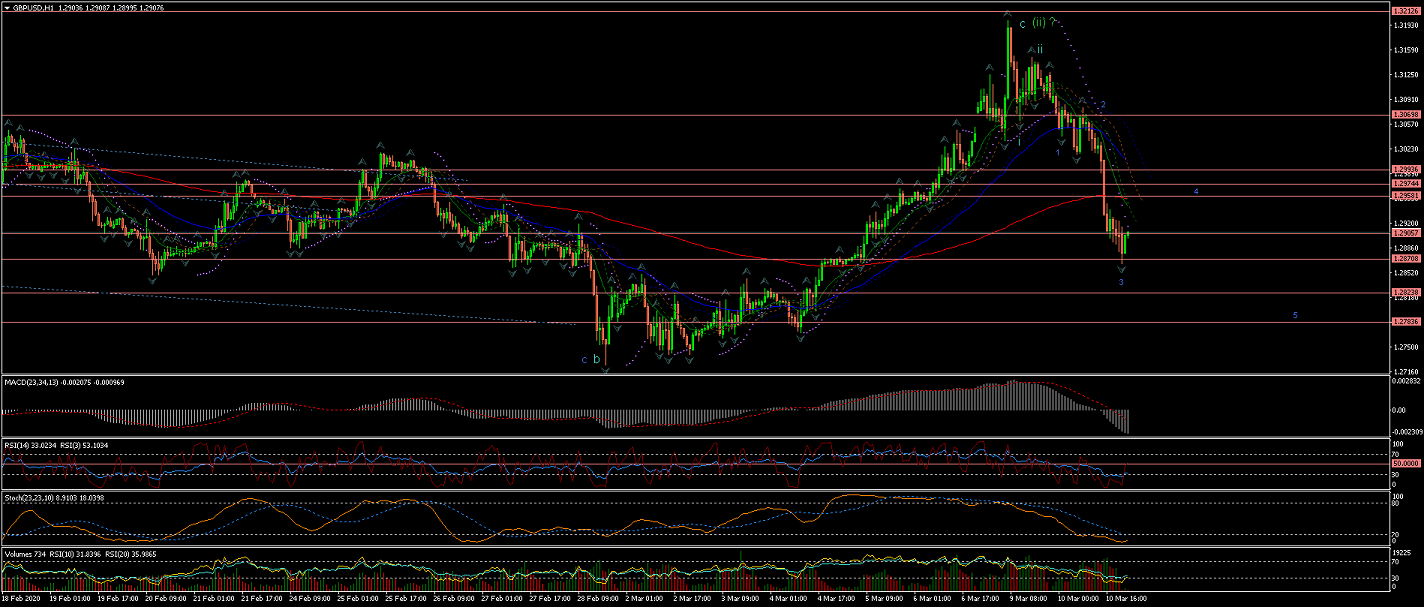
60Min Chart shows Wave 3(blue) of Wave iii (of Wave (iii)) being completed.
To expect a corrective Wave 4(blue) soon.
All the best for everyone and please do not hesitate to contact me if you have any questions or comments.
Andres
info@tradingwaves.org
 Trading Waves .org