Fri 28-02-2020
Hi everyone, hope you are all ok.
Let's get into it...
USDJPY
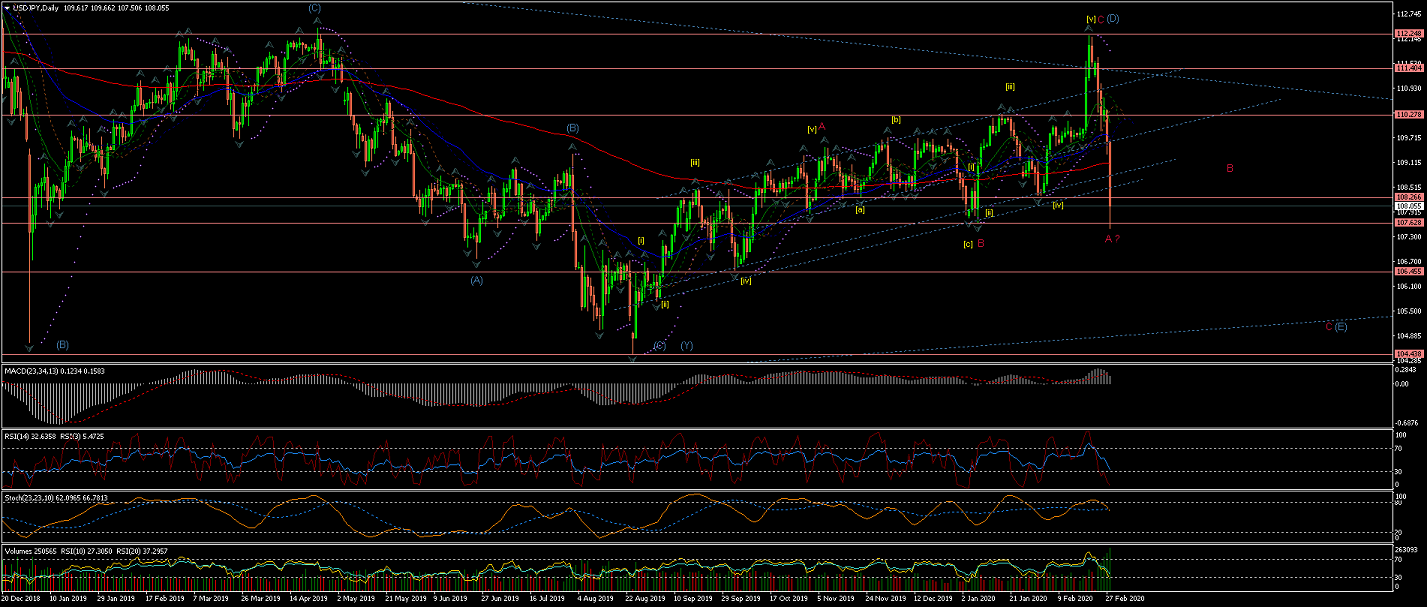
Weekly Chart is showing the price crossed slightly the long term upper trend line for what I have marked now as the most probable count
as current Wave (E) under development (given that the raise to the top trendline does not look as impulsive as expected for a Wave (1) move.
Also, bearing in mind that;
* The Alternate#1 count for an extended Wave (C) of Wave (Y)
Daily Chart is showing the new count (previously Alternate #2)
As Wave (D) completed and Wave A(red) of Wave (E) also possibly completed.
Which leaves for a move up for Wave B(red) next before the price does a last drop towards the lower trendline on Wave C(red) to complete Wave (E)
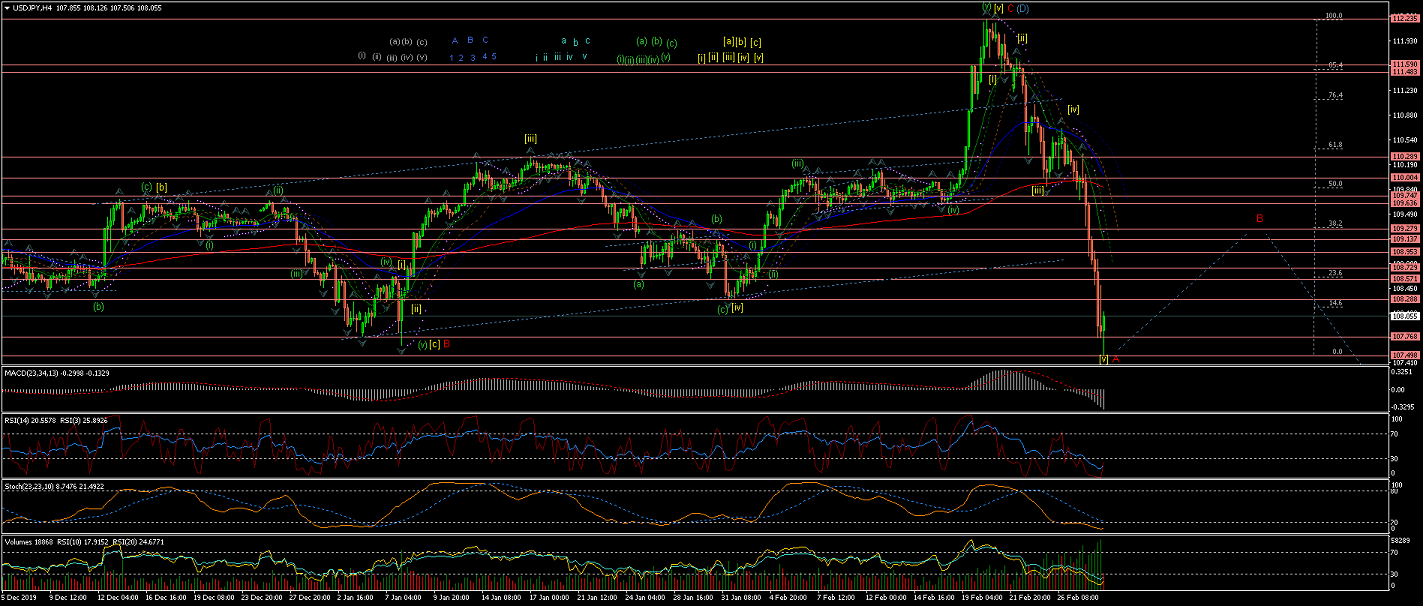
4Hour Chart shows Wave A(red) of Wave (E) possibly completed with 5 impulsive waves down;
Which would call for a raise to complete Wave B(red) towards the %38 retracement of Wave A(red) as the most probable target.
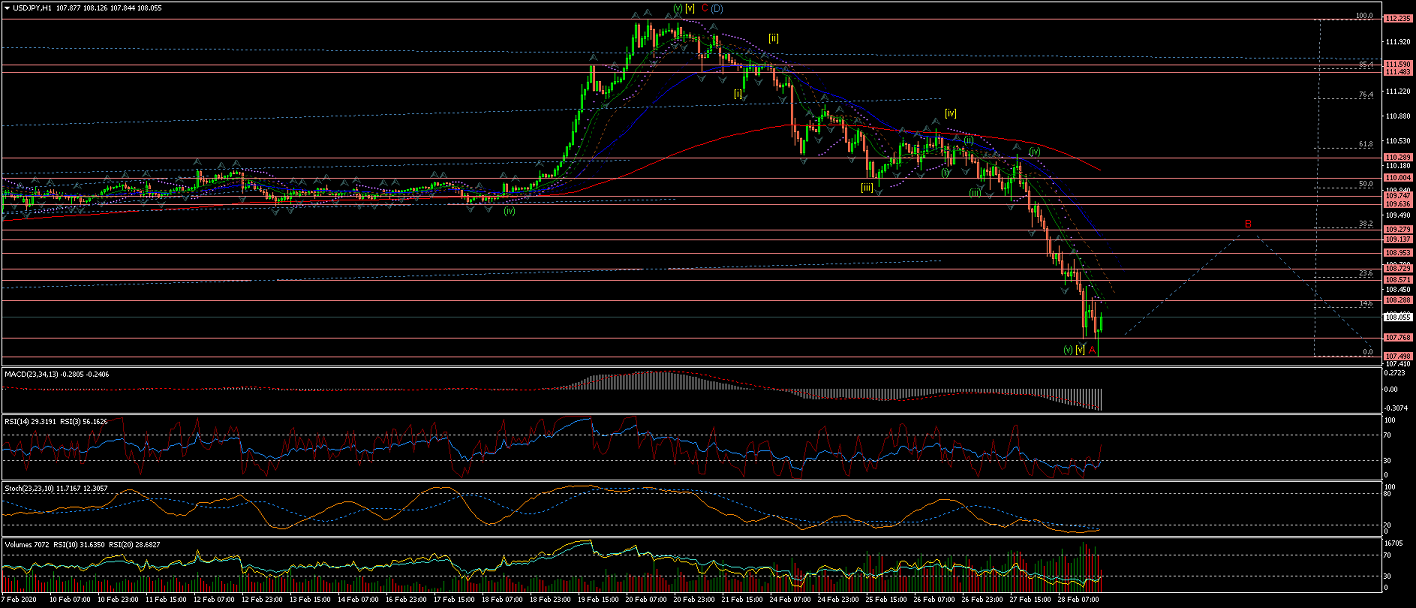
60Min Chart shows in more detail the 5 internal waves of Wave A(red).
And a doji candle that, adding to oversold indicators in the 4Hr and 1Hr Charts, suggest a possible start of Wave B(red)
EURUSD
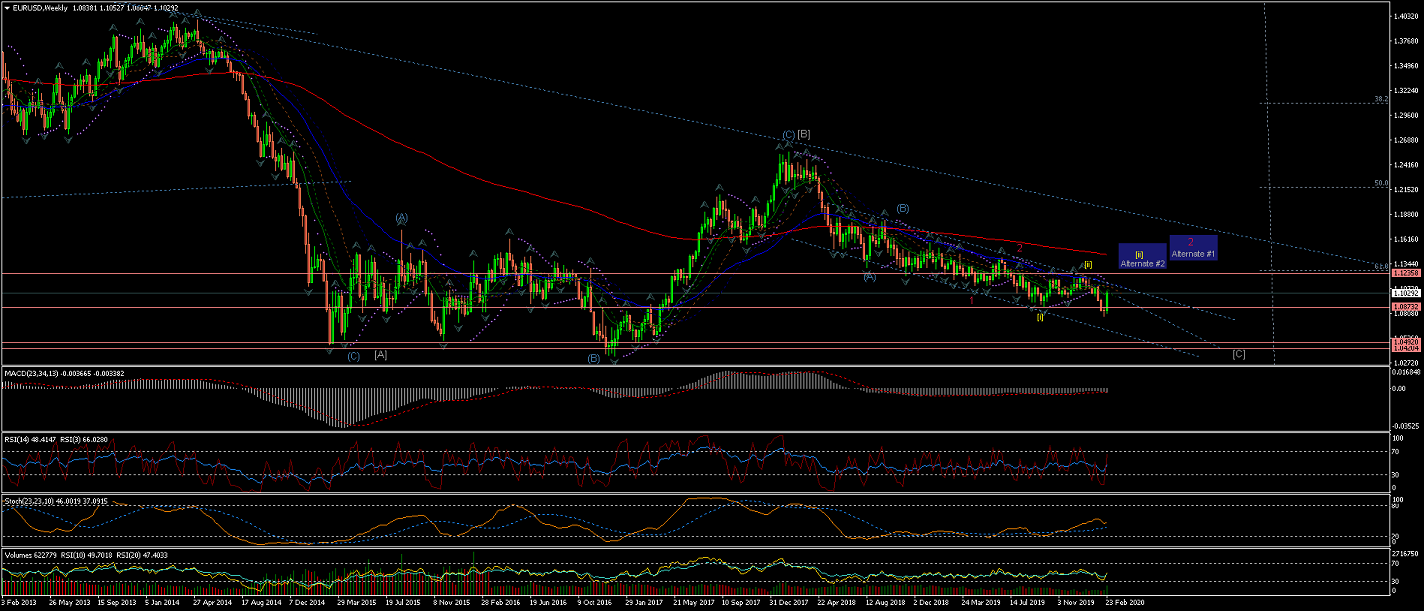
Weekly Chart, under the current interpretation, shows a Wave [C] developing towards
the %76 retracement of the 5-Waves raise from 2002 to 2008.
(This count would lead to the lows of 2014)
Although there are Alternate counts pointing at a further raise for extended corrective Waves [ii] or 2(red)
Daily Chart is showing Wave (i) of [iii] completing at 1.07765.
And now Wave (ii) rallying until the %62 retracement level.
Although it is unclear whether this correction is completed (Alternate #3) or this rally up is simply Wave a of Wave (ii).
The following sessions would help clear this doubt.
Although there is still a possibility for Alternate #1 for a larger Wave 2 (red).
And Alternate #2 for an expanded Flat Wave [ii] to cross the upper trendline again.
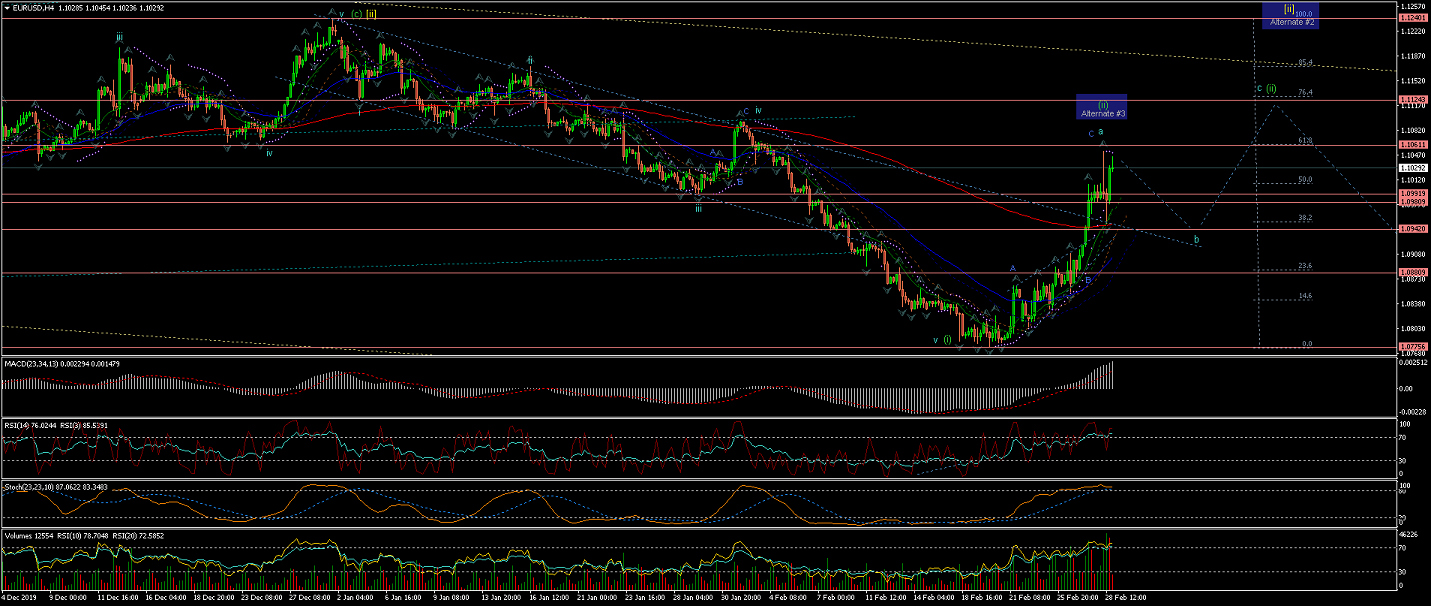
4Hour Chart is showing Wave (ii) completing 3 waves so far that, under the current count,
suggest to be the internal waves of Wave a of Wave (ii).
And to expect the price to lower again to complete Wave b next before Wave c takes th price up again to complete Wave (ii).
I have, however, marked Alternate #3 as an already completed Wave (ii) at this point.
(In any case, there is still a strong bearish sentiment and, after Wave (ii) correction, there is a Wave (iii) that is most likely to carry an even
more impulsive set of impulsive waves to the downside again).
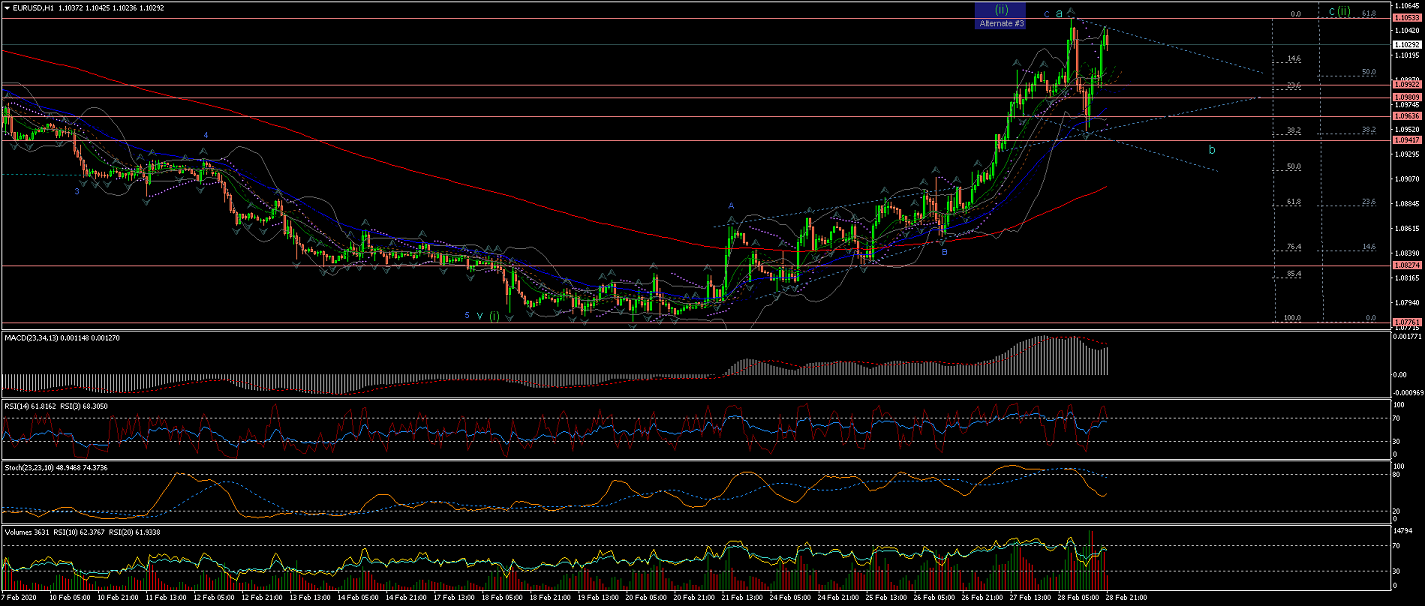
60Min Chart is showing the internal Waves of Wave a of Wave (ii).
And a possible start of Wave b that could be forming a triangle or a range towards the %38 retracement of Wave a.
GBPUSD
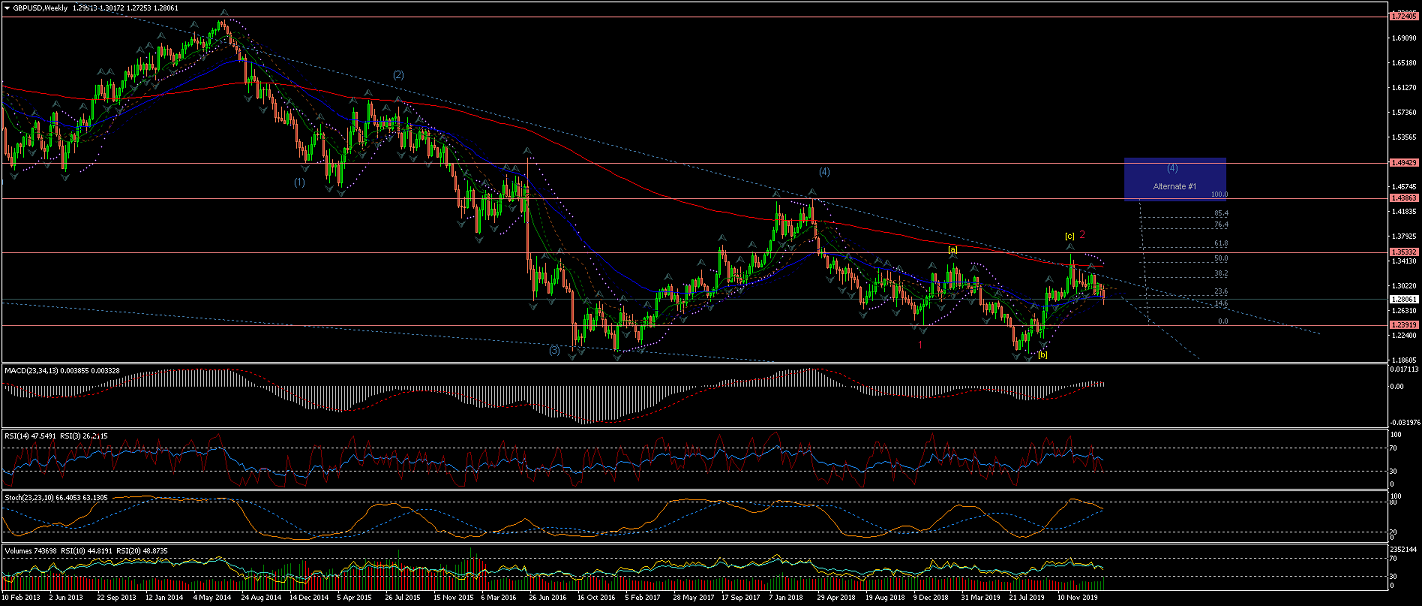
Weekly chart shows Wave 1(red) and a Wave 2(red) correction completed at the 200EMA level with a retracement between %50 and %62 level.
Note Alternate #1 for a larger Wave (4) developing.
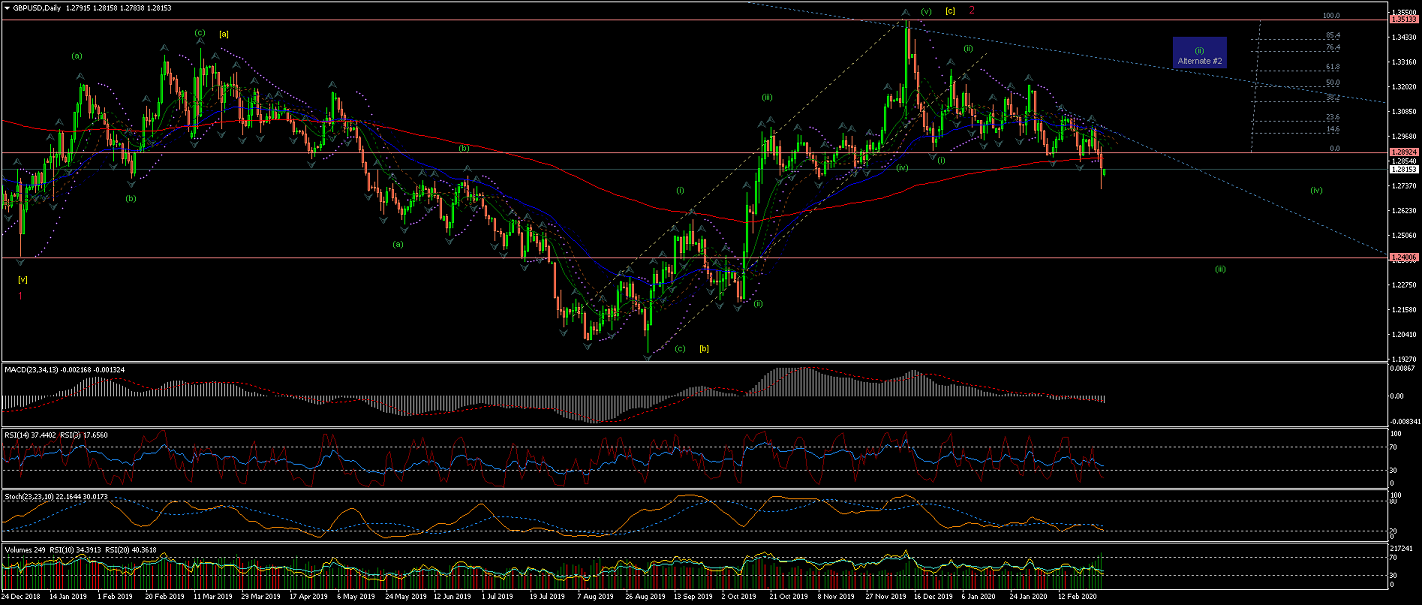
Daily Chart is showing the initials Wave (i) and Wave (ii) of Wave [i](yellow) (of Wave 3(red)) most likely completed.
And now Wave (iii) possibly under development, although yet struggling to cross the lowest of Wave (i)(green) and 200EMA.
Hence, I have marked Alternate #2 for a possible extended Wave (ii) in the form of an expanded Flat correction.
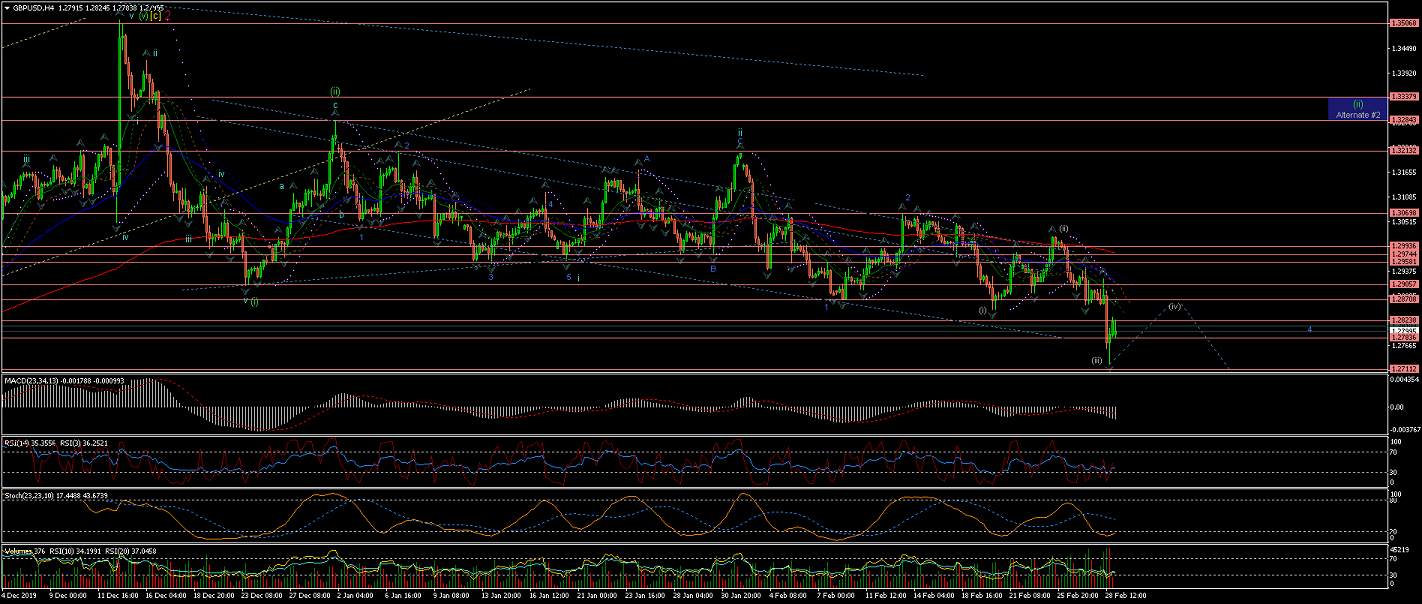
4Hour Chart shows the current count now stands for Waves 1(blue) and Wave 2(blue) of Wave iii completed already.
As per current count, Wave (i) of Wave 3(blue) should now be completed,
although there has not been a clear confirmation that Wave (iii) is underway,
so this correction could extend further and take the price higher and/or take more time to complete.
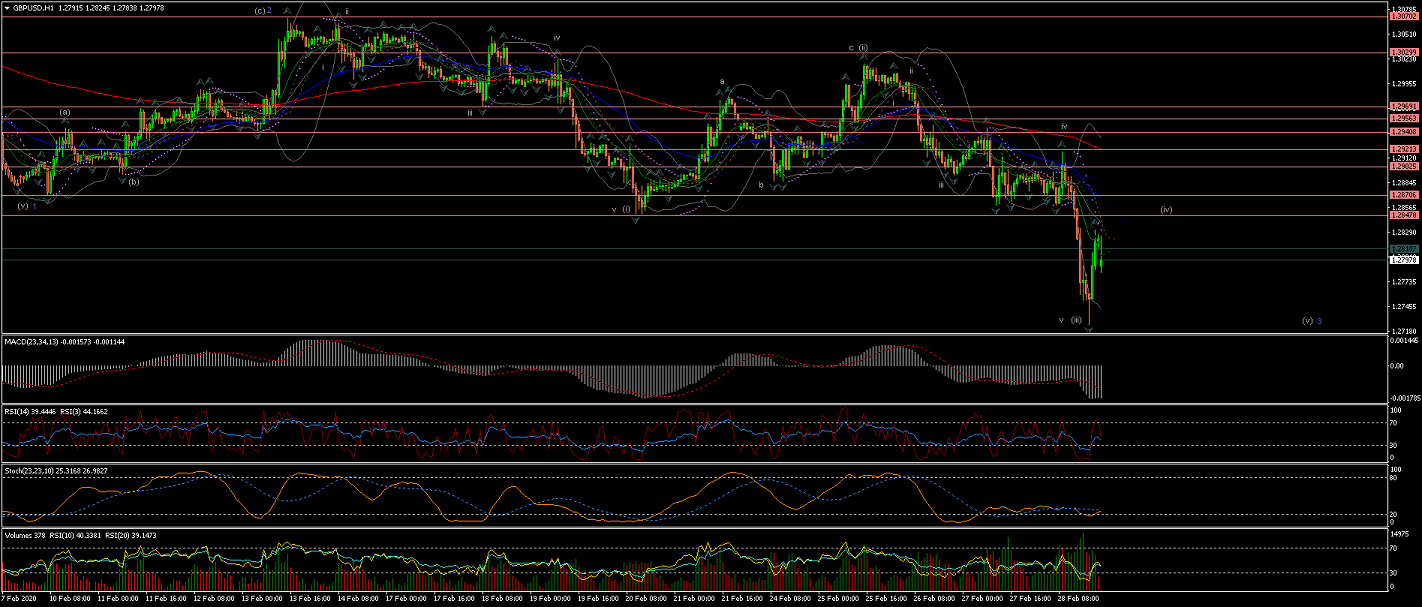
60Min Chart shows 5 waves within Wave (iii) completed
And now a Wave (iv) correction being underway bringing the price up.
All the best for everyone and please do not hesitate to contact me if you have any questions or comments.
Andres
info@tradingwaves.org


 Trading Waves .org