Thu 19-12-2019
Hi everyone, hope you are all ok.
Let's get into it...
USDJPY
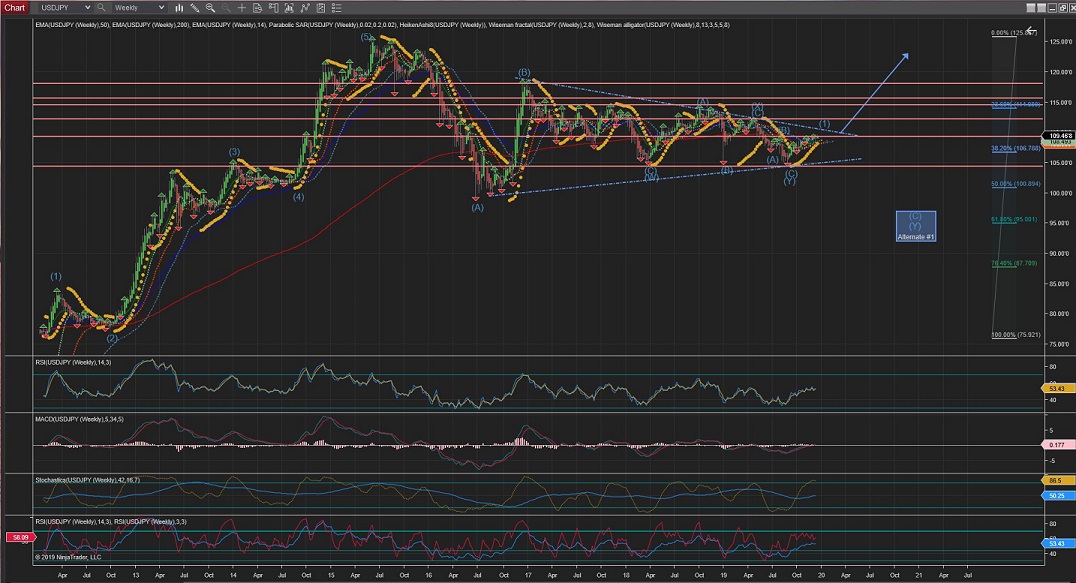
Weekly Chart is still showing impulse to go towards the long term upper trend line for Wave (1), bearing in mind the Alternate#1 count for an extended Wave (C) of Wave (Y).
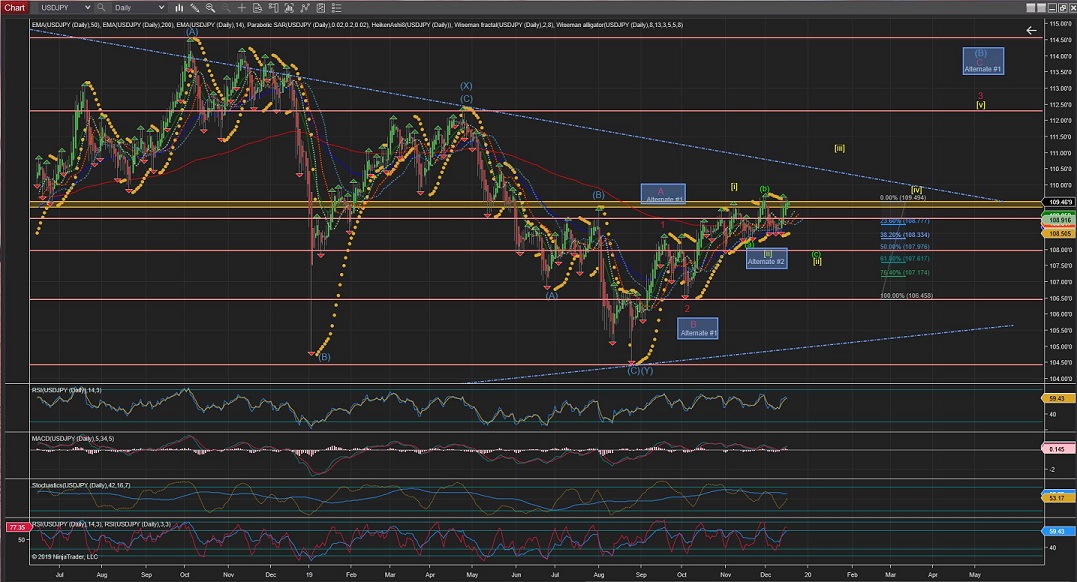
Daily Chart is showing Wave [ii] made a big rally up which left me leaving the possibility of an Alternate #2 count for an already completed Wave [ii] at just %38 retracment.
However, since Wave (b) completed above Wave [i] I am still expecting an expanded flat correction to complete Wave (c) below Wave (a); towards the %50 or %62 retracement level.
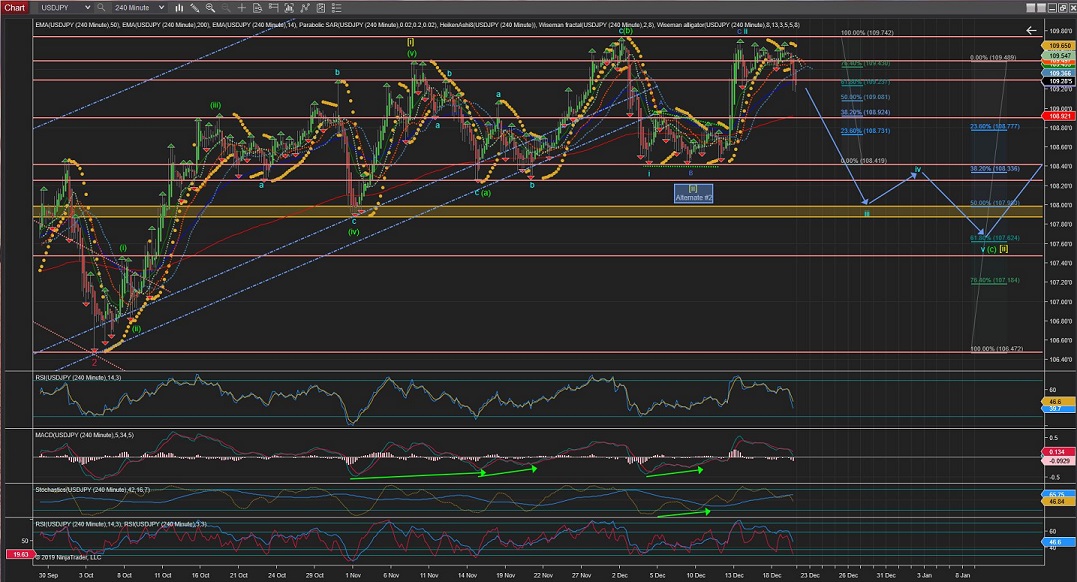
4Hour Chart shows the internal waves of Wave (c) of Wave [ii] expanded flat correction under development; with Wave ii now completed with a huge rally.
And, since then, the start of impulsive moves to the downside which, if it continues to the downside would suggest Wave iii has started (further moves up from the 0 would trigger Alternate #2)
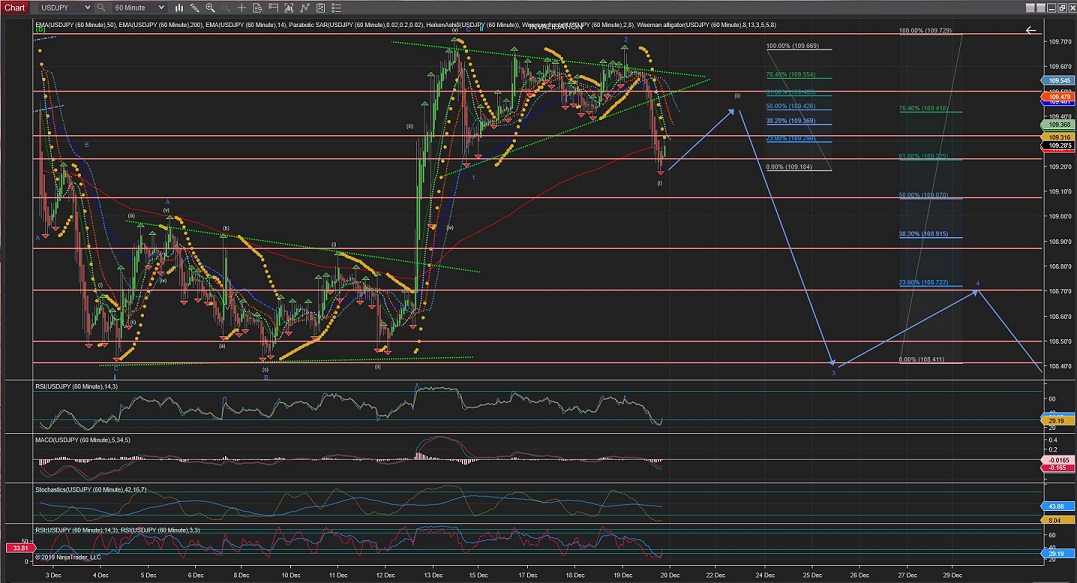
60Min Chart shows Wave (i) Wave iii now completed and Wave (ii) should now start taking over towards resistance levels and the triangle apex just completed.
60Mins
4Hours
Daily
Weekly
EURUSD
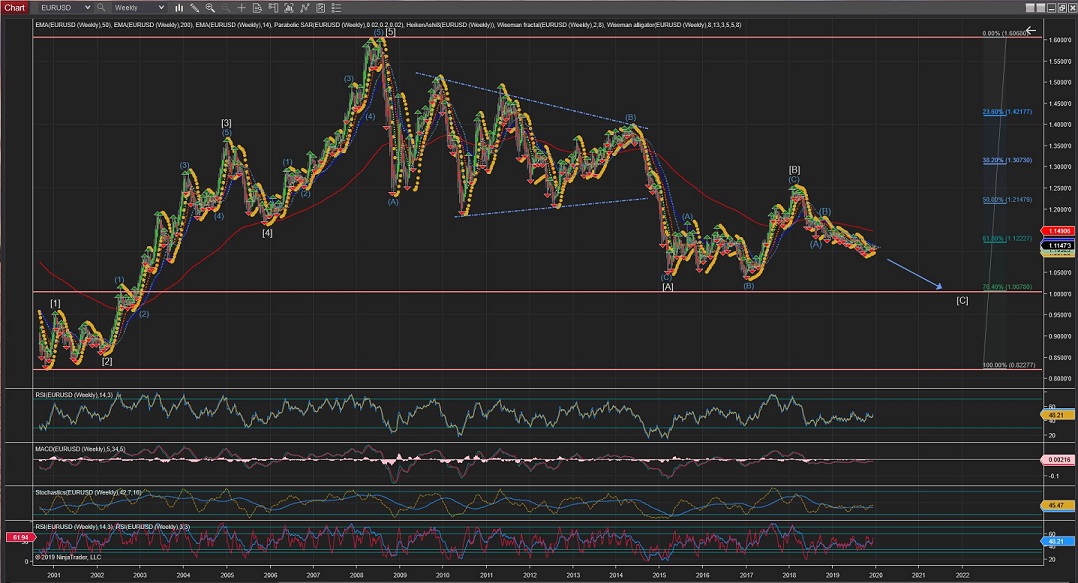
Weekly Chart under the current interpretation, shows a Wave [C] developing towards the %76 retracement of the 5-Waves raise from 2002 to 2008.
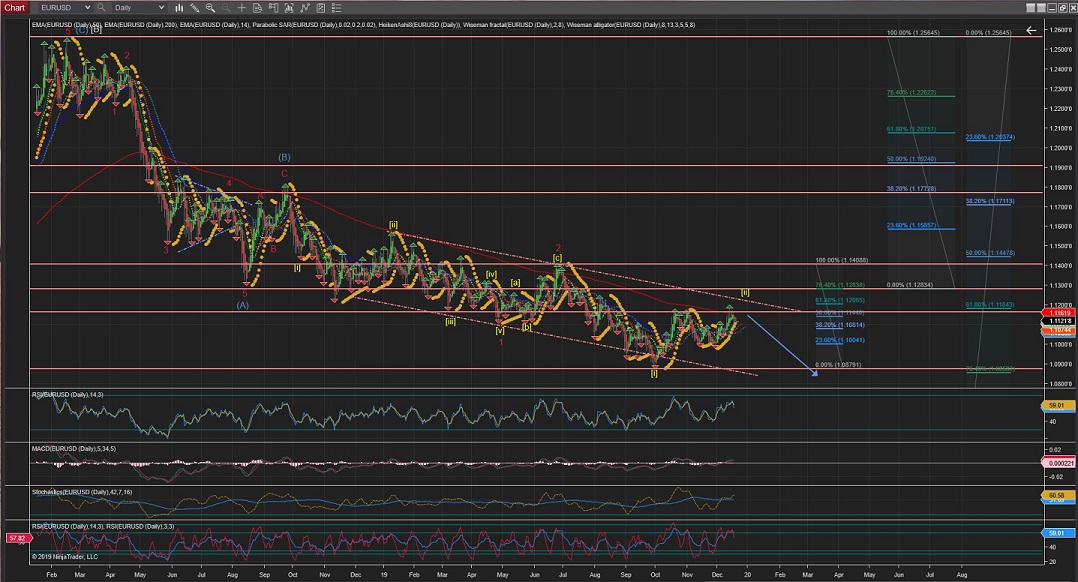
Daily Chart is showing Wave [ii] so far reached the %50 retracement although, the latest raise has triggered the Alternate #1 count for a retracement towards %61 or even %76 at the upper long term trend.
The best interpretation remains to be confirmed, as today this chart is showing the price being rejected at the 200EMA.
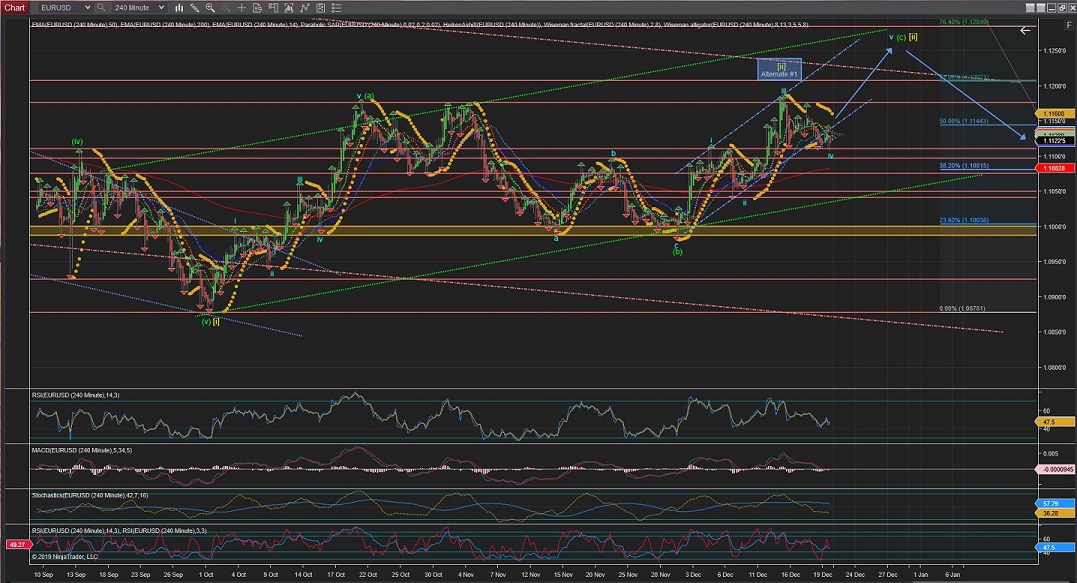
4Hour Chart is showing that the current count now stands for a Wave [ii] Zig Zag correction;
The Zig Zag correction has meet the minimum distance levels (by crossing just above the highest of Wave (a)); Hence, I have marked the new ALternate #1 as an already completed Wave [ii].
As per current count (as Wave iv has not crossed the highest of Wave i); Wave iv is still developing and aiming towards the %62 or above levels.
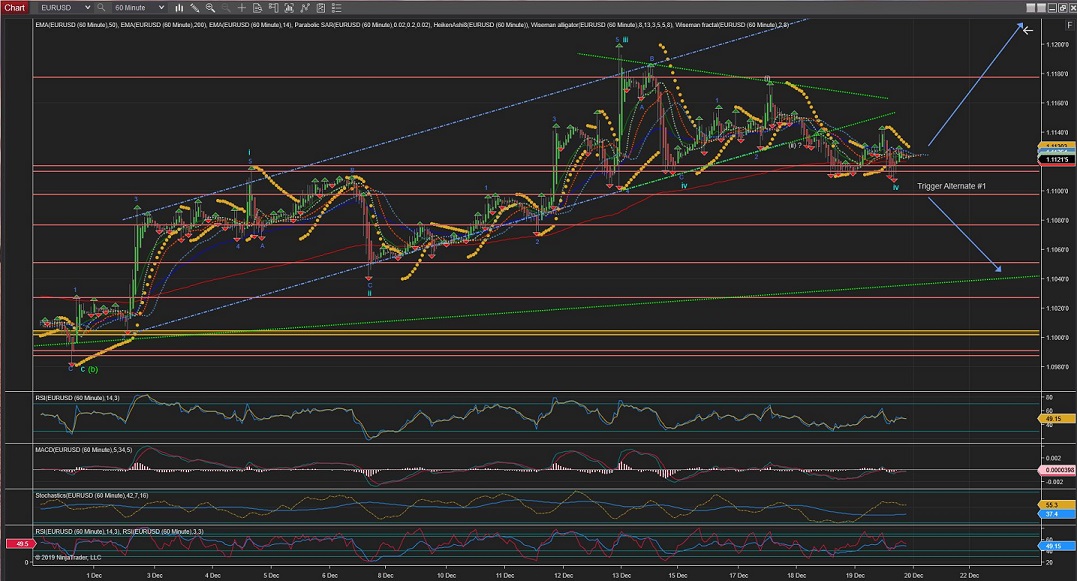
60Min Chart is showing the price action triggered the alternate for an extended Wave iv, although it has already come as closest as it can to the invalidation price level.
Next, the price action would decide whether Wave v picks up the price to complete Wave [ii] or, if the price crosses the high of Wave i to trigger the Alternate #1, we should see further impulsive moves to the downside on to what should be the start of Wave [iii] downwards.
60Mins
4Hours
Daily
Weekly
GBPUSD
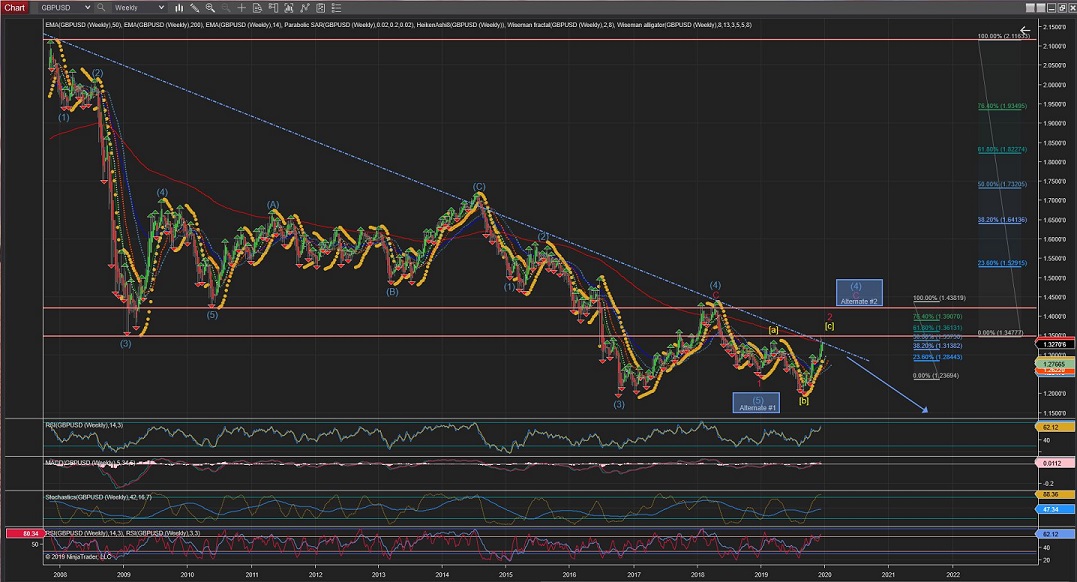
Weekly chart shows a new updated count following Firday's rally triggering a different count for a larger Wave 1(red) and a Wave 2(red) completed (or about to) at the 200EMA level and retracement between %50 and %62 level.
Note that Alternate #1 remains unchanged and I have added a new Alternate #2 for the posibility of a larger Wave (4) developing.
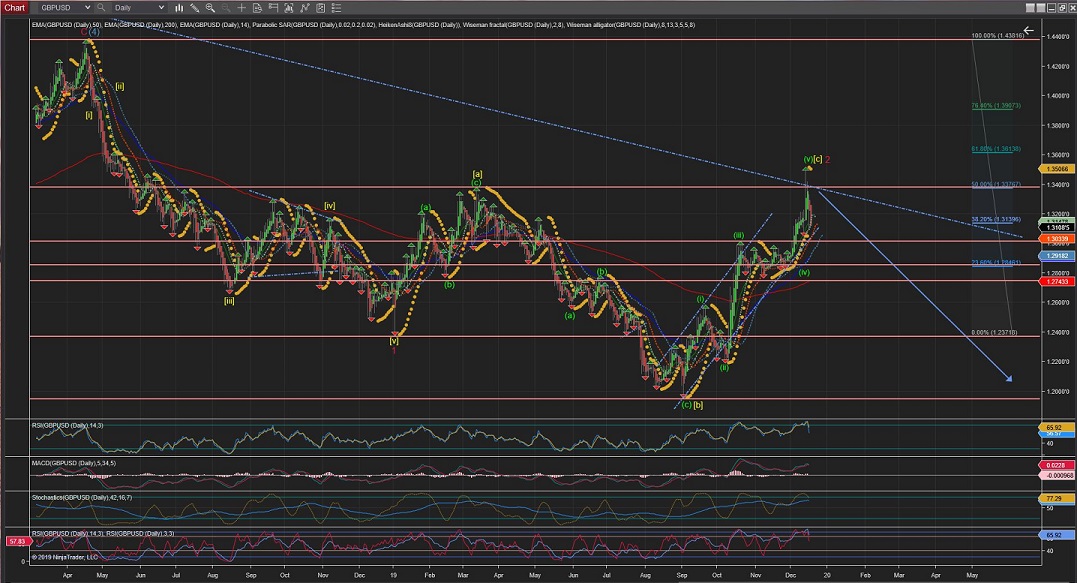
Daily Chart is showing the updated count; with the internal wave counts of Wave 1(red) and Wave 2(red) most likely completed at this point.
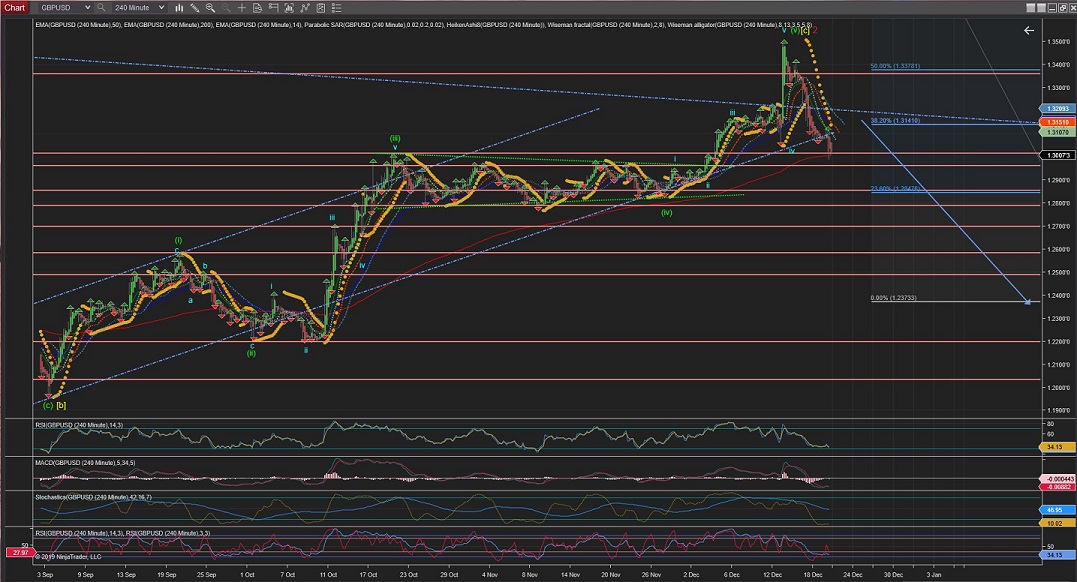
4Hour Chart shows 5 waves completed within Wave (v) of Wave [c] on this updated count; which should have completed Wave 2(red).
And impulsive moves to the downside are already hinting the start of Wave 3(red), although the price still needs to break from the lower trend line and 200EMA.
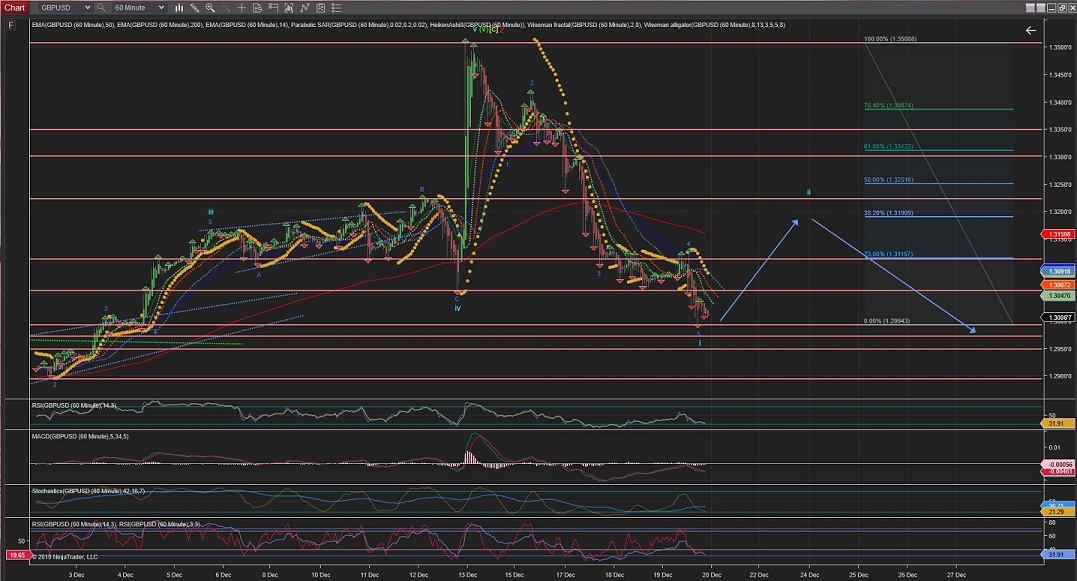
60Min Chart is showing the possible start of Wave 3(red) with 5 impulsive Waves that might have completed Wave i at this point.
Next, Wave ii correction should take the price higher in the next sessions.
60Mins
4Hours
Daily
Weekly
All the best for everyone and please do not hesitate to contact me if you have any questions or comments.
Andres
info@tradingwaves.org
 Trading Waves .org