Fri 29-11-2019
Hi everyone, hope you are all ok.
Let's get into it...
USDJPY
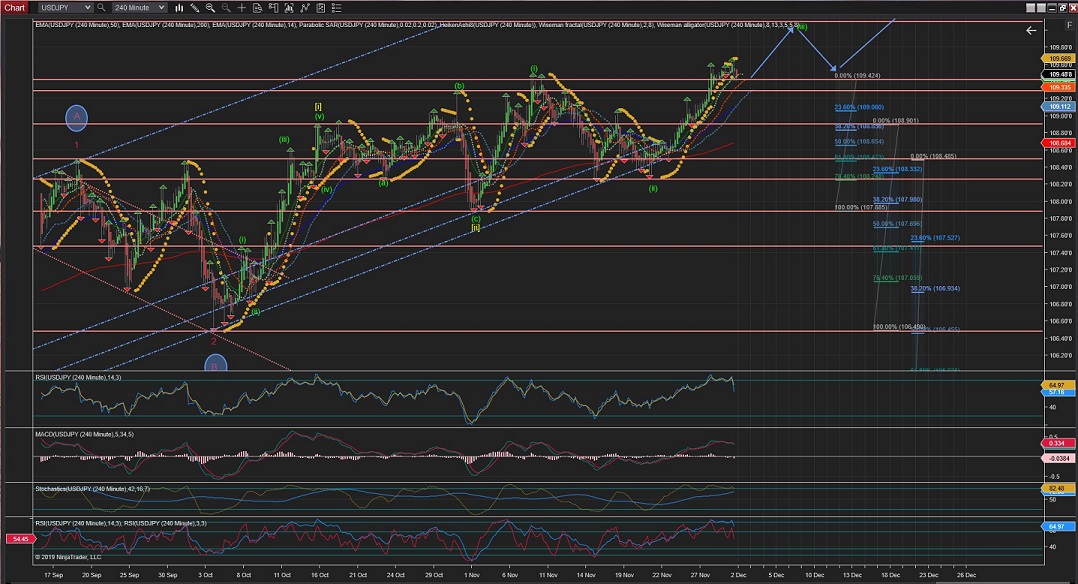
USDJPY Daily and 4Hour Charts are showing a possible Wave [iii] under development, almost leaving behind the Alternate #1 count for a possible extended Wave [ii].
The 4Hour Chart is showing Wave (ii) of Wave [iii] completed at exactly %76 retracement and it has bounce of the low trend-line impulsivelly into what is now reaching to be a Wave (iii) with the same length (so far) as Wave (i).
The 60Min Chart shows Wave iii completed with 5 clearly impulsive waves.
Wave iv correction it is now taking its turn; And for the rule of alternation, as Wave ii was a deep correction, Wave iv should be a more moderate correction (i.e. a flat or triangule correction) and, regardless, should not enter the price of Wave 1 (@ 109.10).
Wave iv price is moving within a bande range to whcich the breakout could lead the prices up for Wave v or down for an extended Wave iv; Regardles of the move, the price should remain above the end of Wave i at 109.08 for this count to remain valid.
The next level of Resistance for Wave v of Wave (iii) potential target is the 110.10 price (visible in the Daily Chart).
60Mins
4Hours
Daily
Weekly
EURUSD
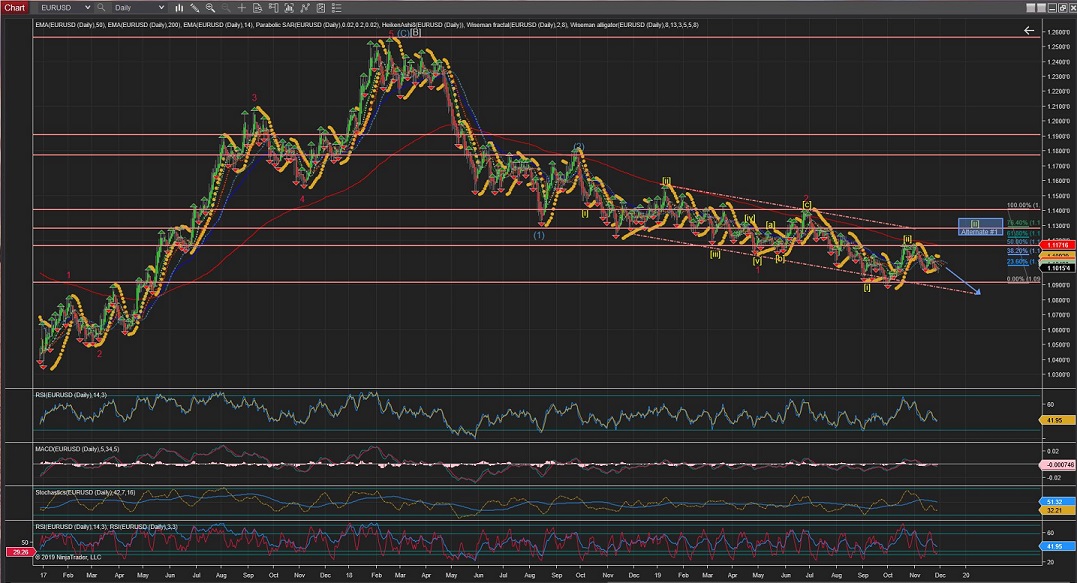
EURUSD Daily Chart is showing Wave [ii] possibly completed at %50 retracement, although there is still posibility that the correction gets extended to trigger the Alternate #1 count for a greater retracement.
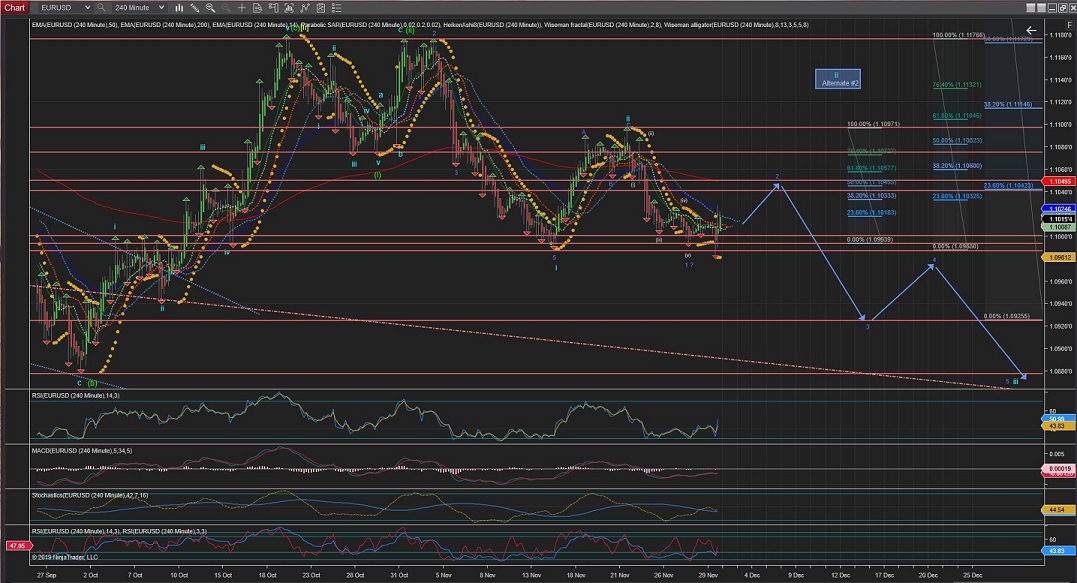
The 4Hour Chart shows a Wave ii that might have found completion at just below the %62 retracement level.
The Alternate #2 for a Wave ii extending towards the %76 level is also possible and Wave iii would only be confirmed after crossing the end of Wave i at 1.0988.
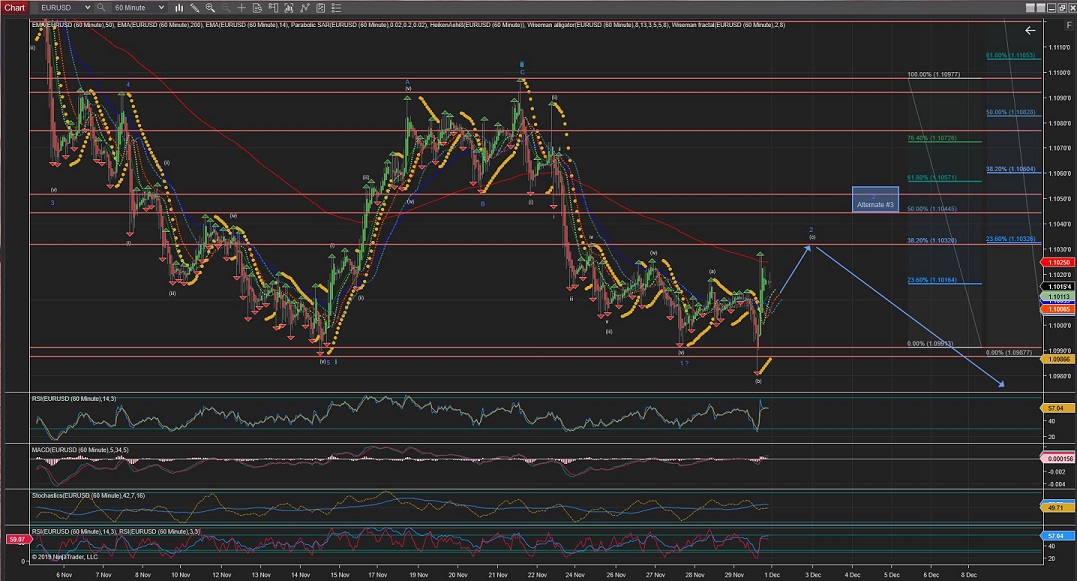
In the meantime, as per current count, Wave 1 (blue) of Wave iii seems to have completed and Wave 2(blue) correction should be now on its way.
The 60Min Chart shows more in detail current Wave 1(blue) of Wave iii internal waves, where Wave 2(blue) could be developing a Zif Zag Correction (5,3,5) with current wave potentially being Wave (c) (of Wave 2(blue).
I have added an Alternate #3 for an extended Wave 2(blue) ending at the %50 or %62 levels although there is enough resistance for this correction to end early at the %38, just above the 200EMA, before it continues with the main trend, as per current count.
60Mins
4Hours
Daily
GBPUSD
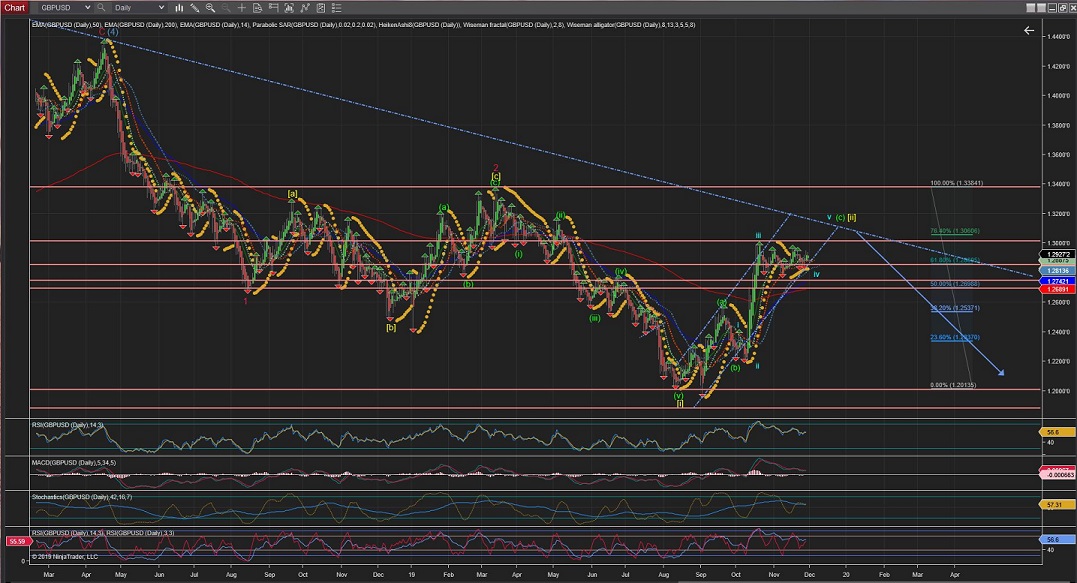
GBPUSD has moved sideways throughout the few past weeks and recent moves have trigered the Alternate count for an extended Wave [ii] aiming at a long term trendline and the %76 retracement level (best seen in the Daily Chart).
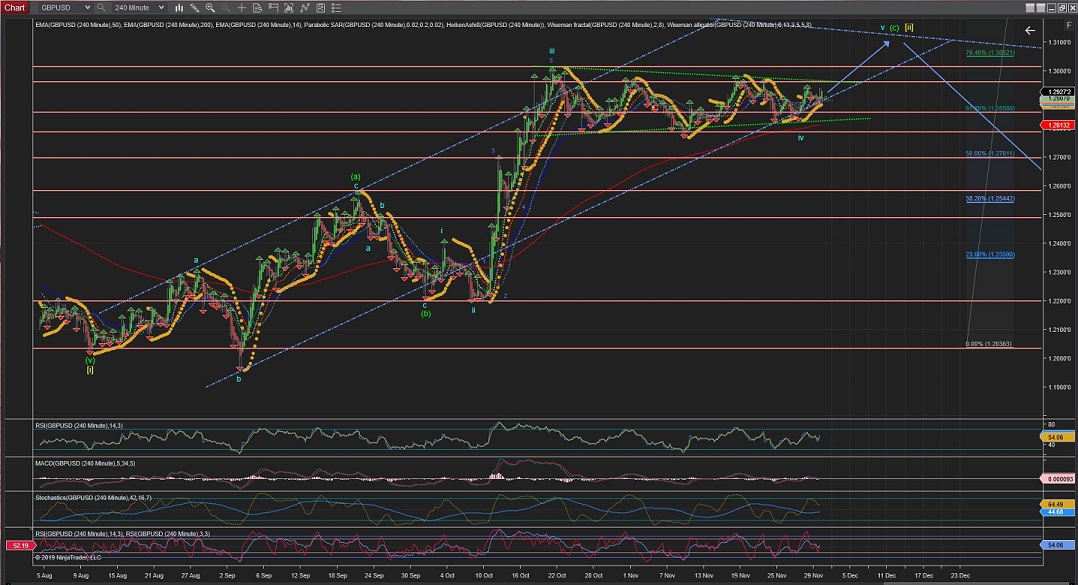
The 4Hour Chart shows that Wave iv could potentially come to an end by breaking out of the wedge formation of the past weeks.
This potential break out should complete Wave v of Wave (c) of Wave [ii] at around the %76 retracement level.
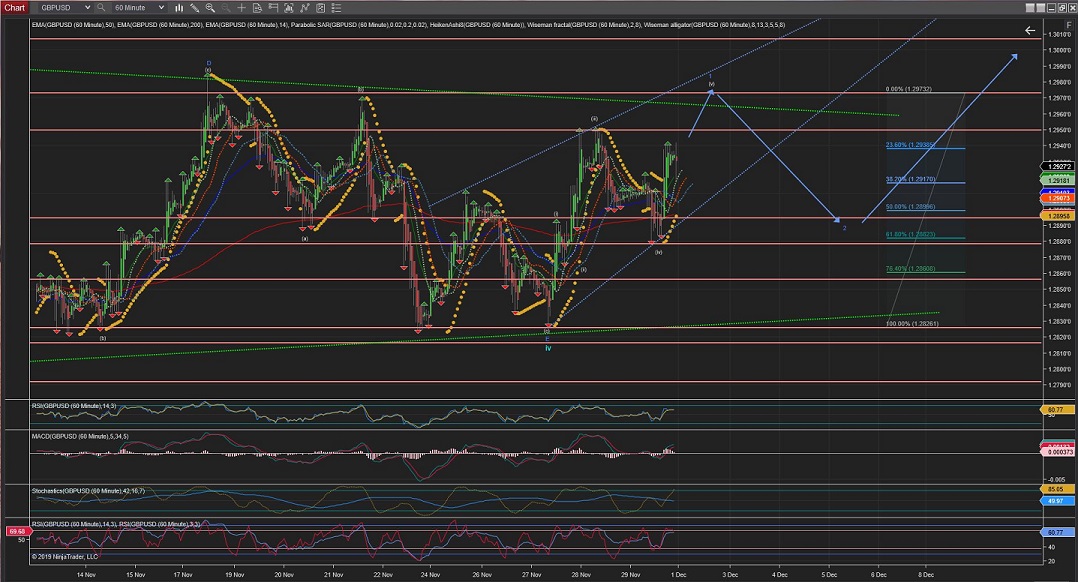
The 60Min Chart is now showing a potential diagonal raise formation, with 4 Waves so far, for what could be Wave 1(blue) after a completed Wave iv.
The corrective Wave (iv) has now entered the price of Wave (i) as an excepcion for a diagonal formation and Wave (v) has now picked up towards the lower trend channels.
Next; once Wave (v) completes Wave 1(blue), The price should drop for Wave 2(blue) correction.
60Mins
4Hours
Daily
All the best for everyone and please do not hesitate to contact me if you have any questions or comments.
Andres
info@tradingwaves.org


 Trading Waves .org