Tue 26-11-2019
Hi everyone, hope you are all ok.
Let's get into it...
USDJPY
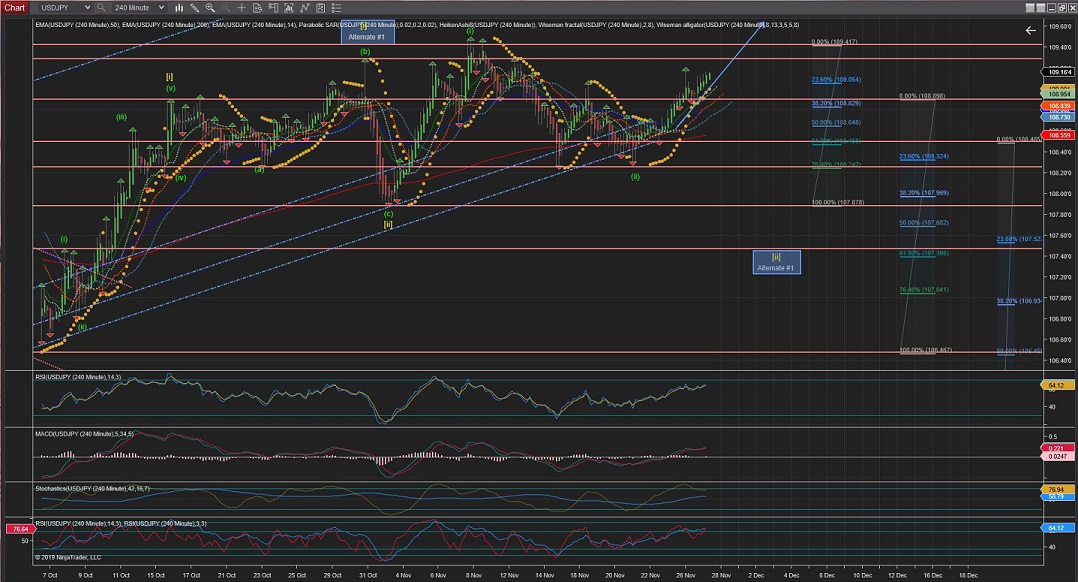
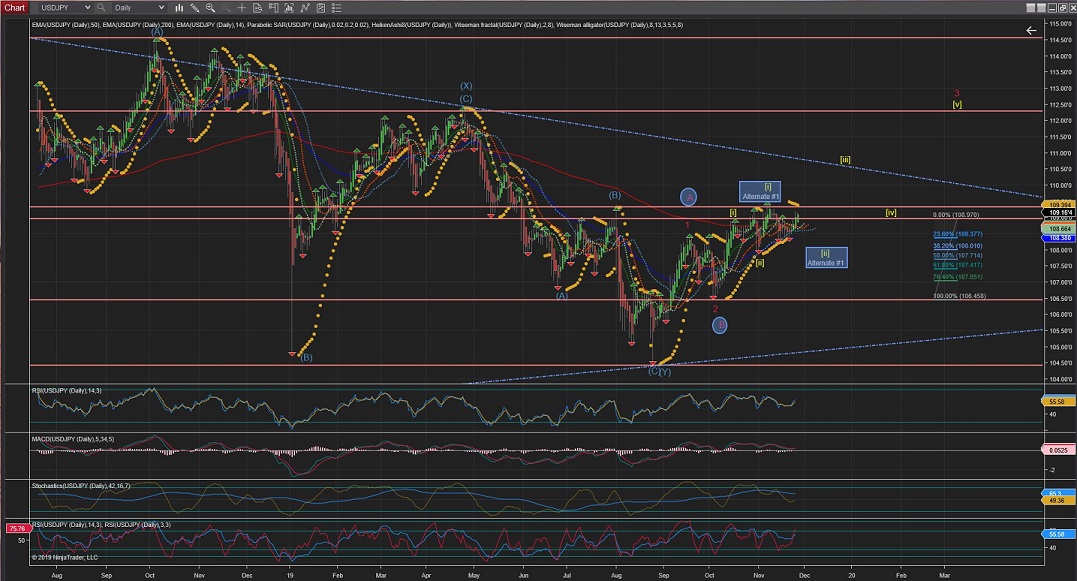
USDJPY Daily and 4Hour Charts are showing a possible Wave [iii] under development, although an Alternate #1 for a possible extended Wave [ii] is still in the cards.
The 4Hour Chart, under the current count, is showing a possible Wave (ii) of Wave [iii] completed at exactly %76 retracement and it has bounce of the low trend-line ijmpulsivelly into a possible start of Wave (iii).
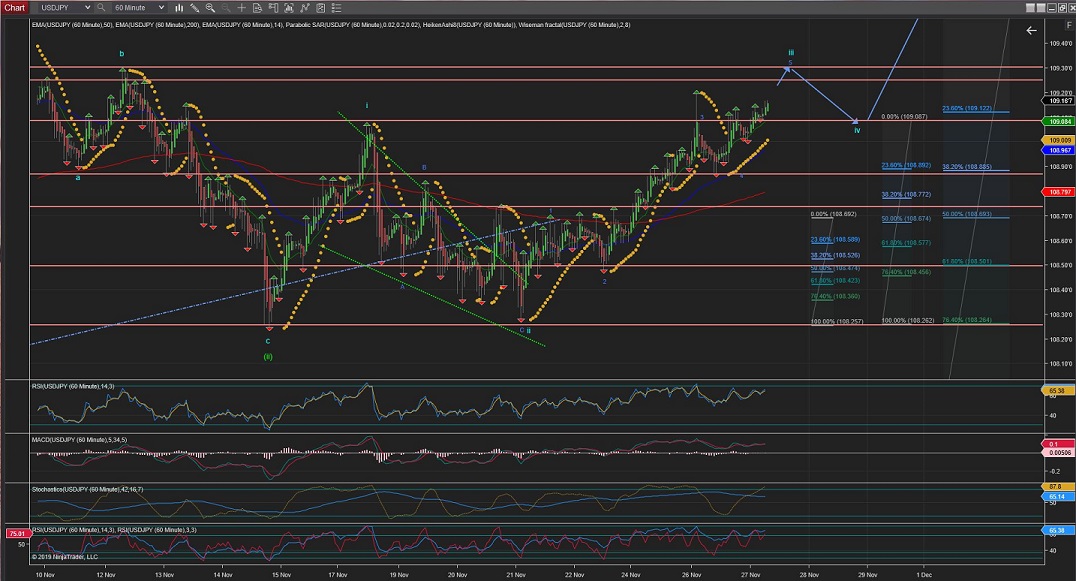
The 60Min Chart shows Wave 5(blue) of Wave iii still picking up the prices impulsivelly across the highest of previous Wave i, and the price at this point should remain above the highest of Wave 1(blue) at 108.70 even when Wave 5(blue) is complete and Wave iv correction takes its turn.
60Mins
4Hours
Daily
Weekly
EURUSD
EURUSD Daily Chart is showing Wave [ii] possibly completed at %50 retracement, although there is still a real posibility that the correction gets extended to trigger the Alternate #1 count for a greater retracement; This coming week would decide between the alternate vs the current count.
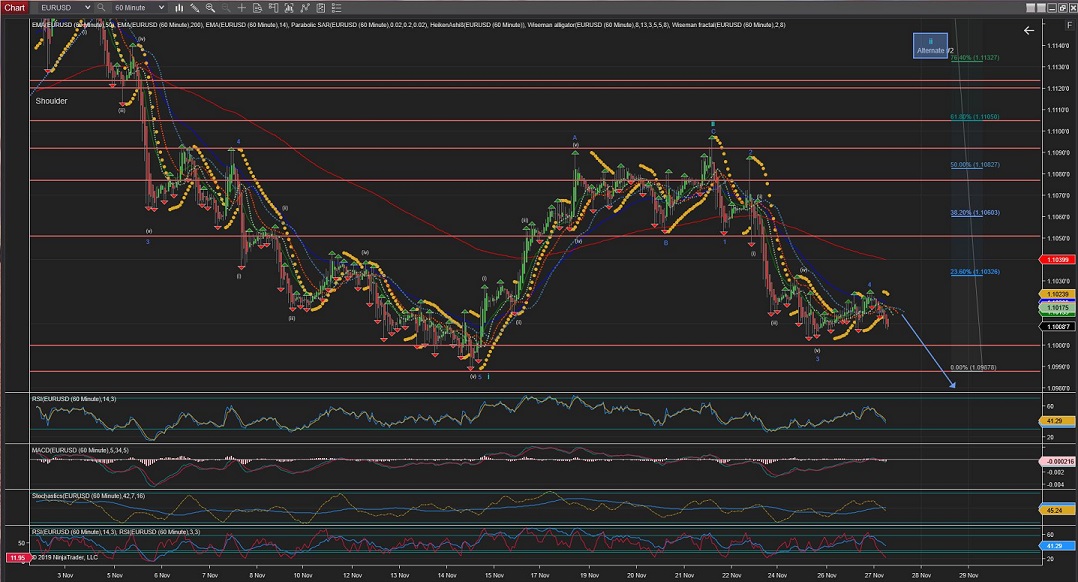
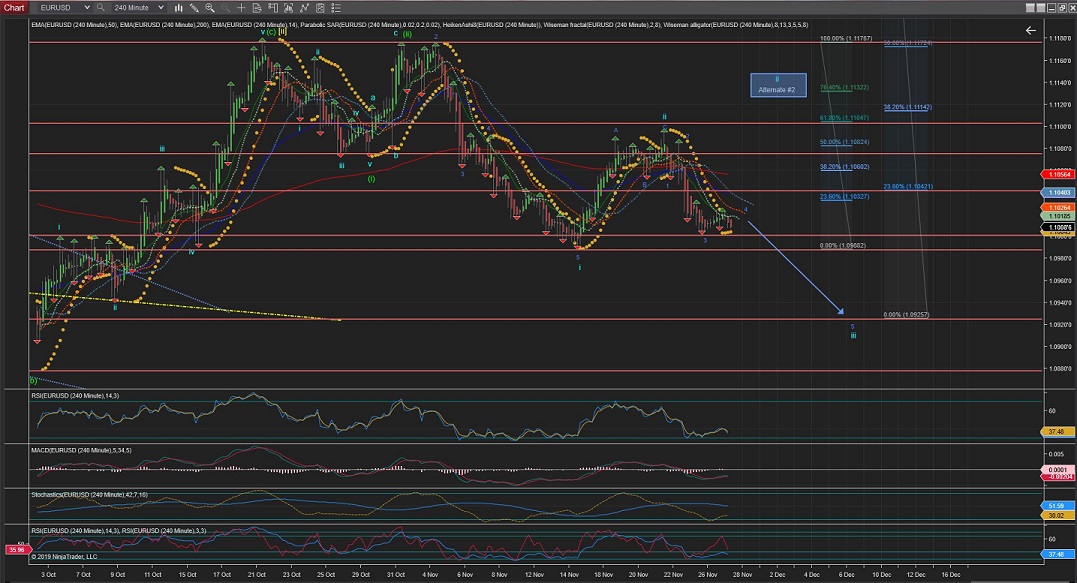
The 4Hour Chart shows a Wave ii that might have found completion at just below the %62 retracement level as impulsive waves pushes further down.
Wave 1, 2, 3 and 4 (blue) of Wave iii are completed and Wave 5(blue) of Wave iii seems to have just started.
(Please note the Alternate #2 for a Wave ii extending towards the %76 level).
Also note that, to match the length of Wave i, the internal waves (labelled in blue) of Wave iii should be re-labelled to a lower degree unless the current Wave 5(blue) gets very extended.
The 60Min Chart shows more in detail current Wave iii internal waves, where Wave 4(blue) might have just been completed and a Wave 5(blue) should be underway.
60Mins
4Hours
Daily
All the best for everyone and please do not hesitate to contact me if you have any questions or comments.
Andres
info@tradingwaves.org


 Trading Waves .org