Fri 15-11-2019
Hi everyone, hope you are all ok.
Let's get into it...
USDJPY
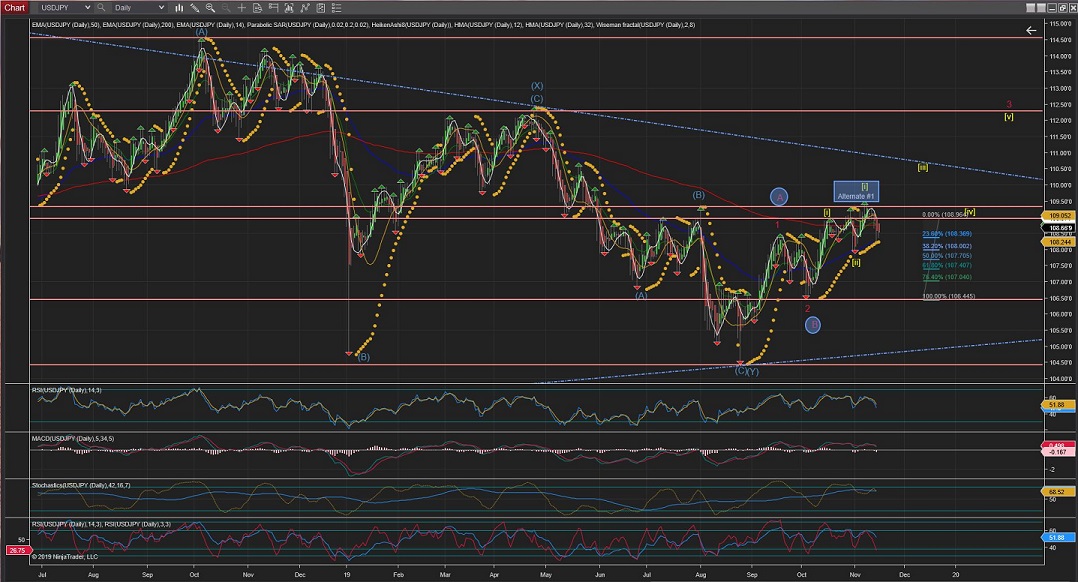
USDJPY Daily and 4Hour Charts are showing an ongoing Wave [ii] ZigZag (5,3,5) correction in its last internal wave.
Crossing the most recent highest would invalidate the Alternate count and confirm Wave [iii].
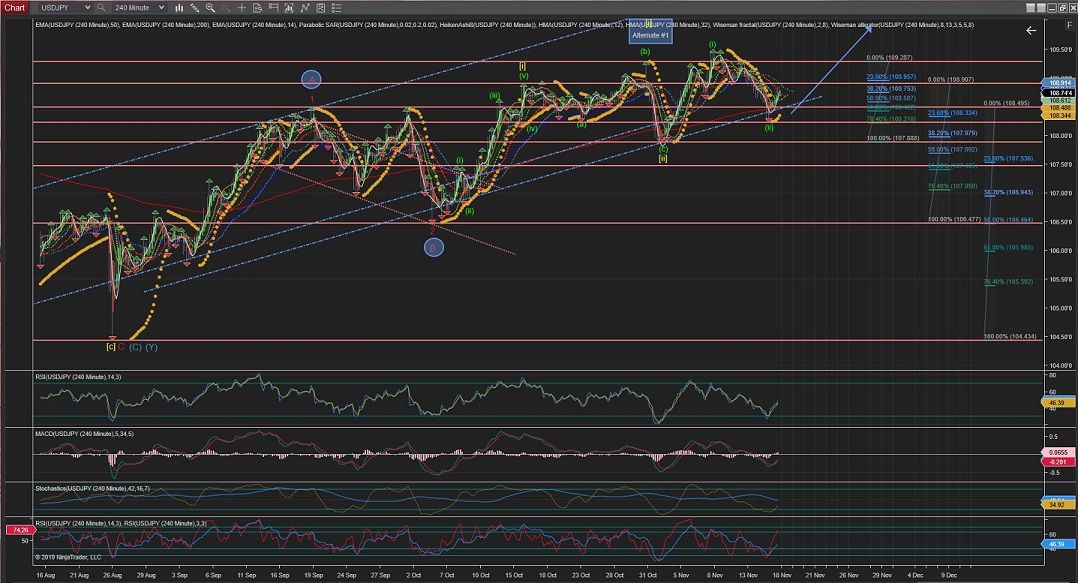
The 4Hour Chart is showing a possible Wave (ii) of Wave [iii] completed at exactly %76 retracement of Wave (i).
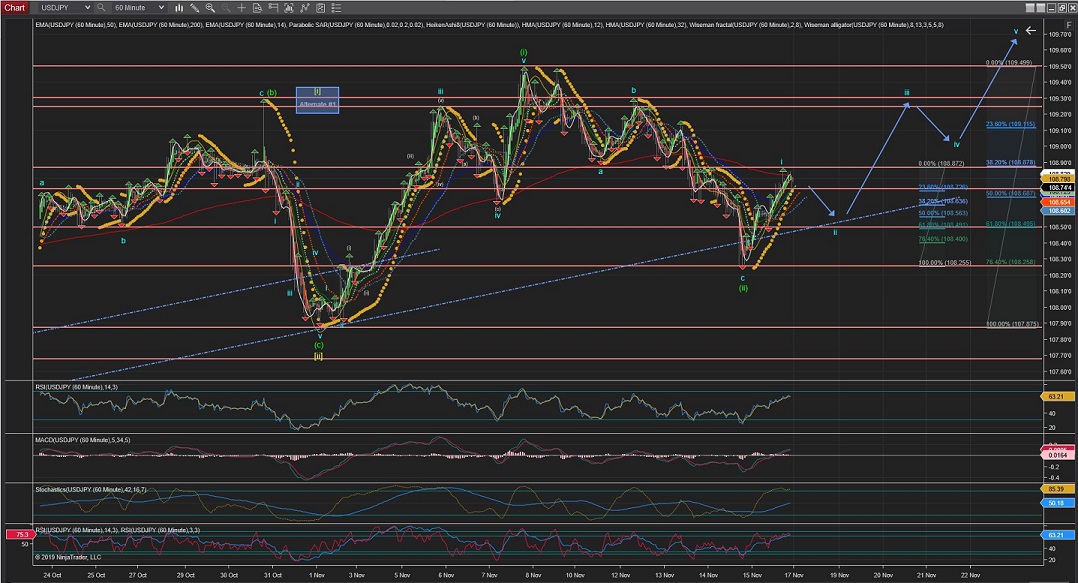
The 60Min Chart has ended the week completing Wave i at the 200EMA with 5 clear internal waves.
Next we should expect a Wave ii correction towards the 108.50 price level before picking up Wave iii to raise the prices higher across the 109.00 price barrier.
60Mins
4Hours
Daily
Weekly
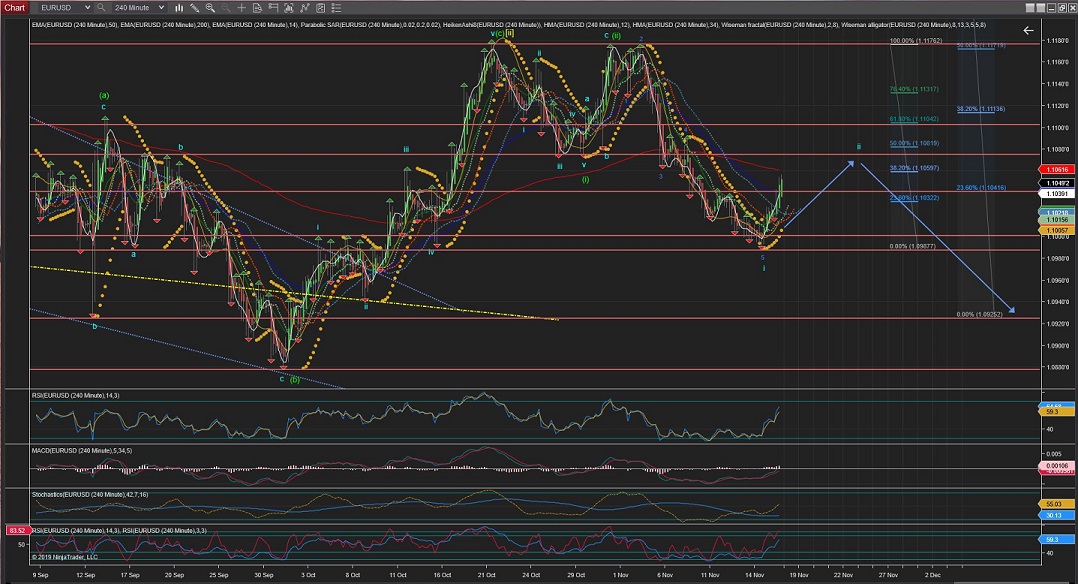
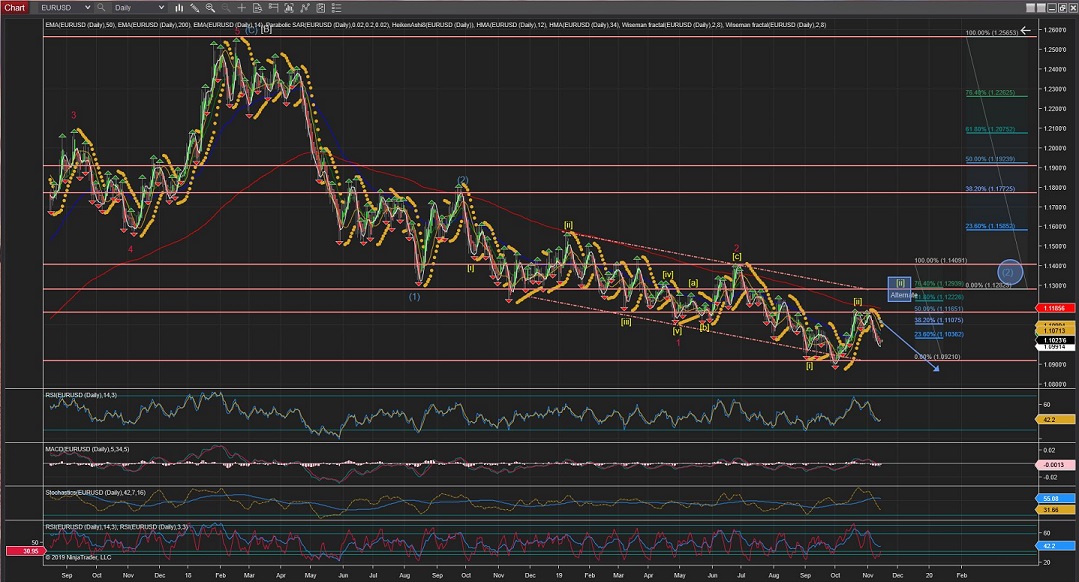
EURUSD
EURUSD Daily Chart is showing Wave [ii] possibly completed at %50 retracement, although there is still a real posibility that the correction gets extended to trigger the Alternate #1 count for a greater retracement; This coming week would decide between the alternate vs the current count.
The 4Hour Chart shows a very convincing Wave i with 5 internal waves very impulsive to the downside and a Wave ii rallying higher now for a correction before the price continues to the downside for Wave iii, as per current count.
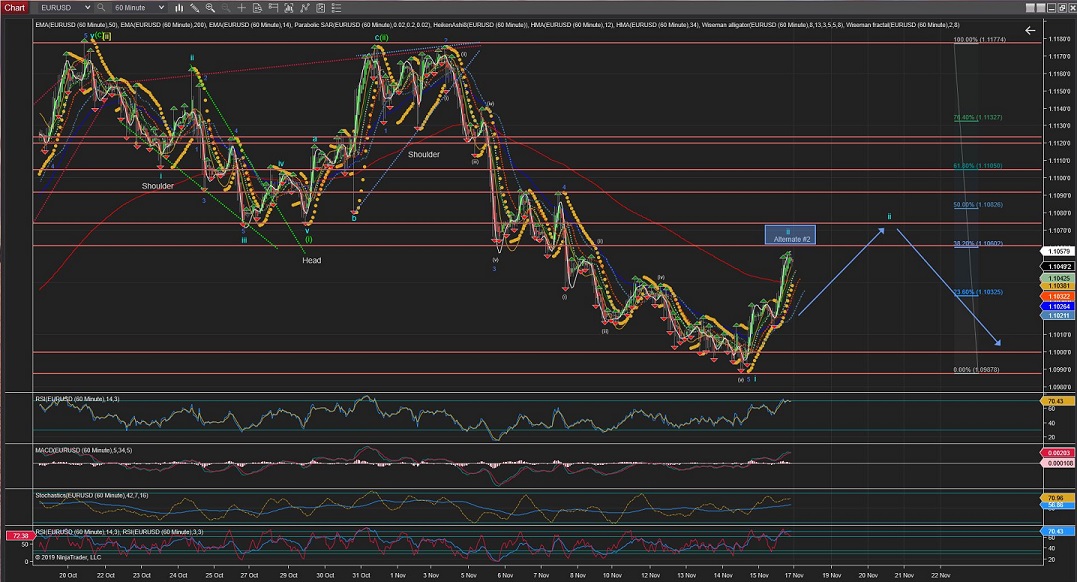
The 60Min Chart shows more in detail Wave i internal waves and also the posibility of an already completed Wave ii correction ending at %38 retracement; marked as Alternate #2.
Although the count that I am expecting and, hence marked as the main count, is for a corrective Wave ii to aim at higher retracement leves; i.e. %50 level (at the 1.1082 price level).
60Mins
4Hours
Daily
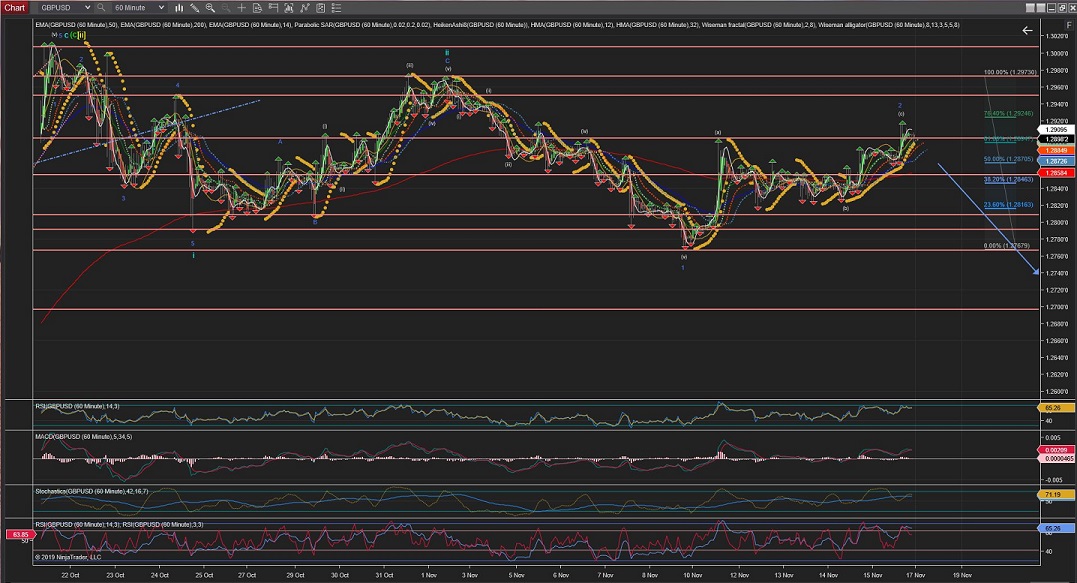
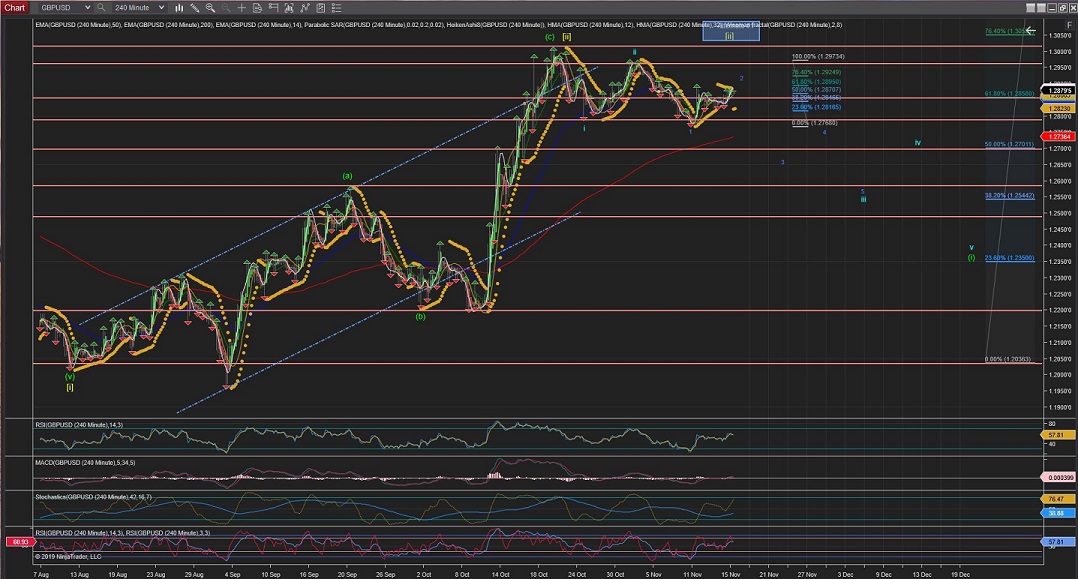
GBPUSD
GBPUSD has moved little throughout this week in the current correction but the current count remains the preferred count as it is looking now to reverse into Wave [iii] to the downside, although it has not picked up very impulsive waves to the downside yet.
(The other Alternate count marked is for an extended Wave [ii] correction reaching the %76 retracement level or slightly higher).
The 4Hour Chart shows Wave iii might have started with an internal Wave 2 correction now almost reaching the %76 retracement level.
The 60Min Chart is now showing the internal waves for Wave 1 (blue) and Wave 2 possibly completed.
I'm expecting the price to drop more impulsively, and the price to continue much lower after Wave 2 correction, to remain the current count valid in this Wave iii continuation.
60Mins
4Hours
Daily
CADJPY
CADJPY Weekly Chart shows 5 clear waves to the downside (2008-2009) and a correction that might have completed in 2015.
Which brought the price back down since then until 2017 (unless the correction is still being extended, as marked in the Alternate counts).
The whole count to today has formed a downwards triangle that also suggest that the price could breakout lower, continuing the mayor trend.
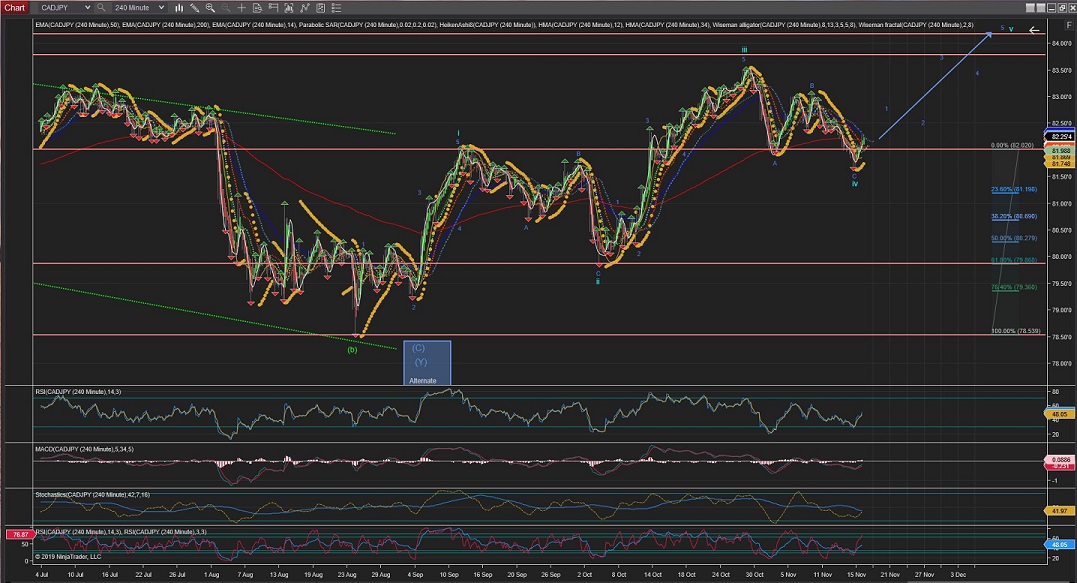
CADJPY Daily Chart shows that the price is targetting the upper triangule trend line in Wave (c) of Wave [ii] with a continuation of Wave v to the upside again.
CADJPY 4Hour Chart is showing that Wave iv has completed with an extended correction at the same height as the end of Wave i by touching the 200EMA twice and now starting to pick up momentum to the upside for Wave v.
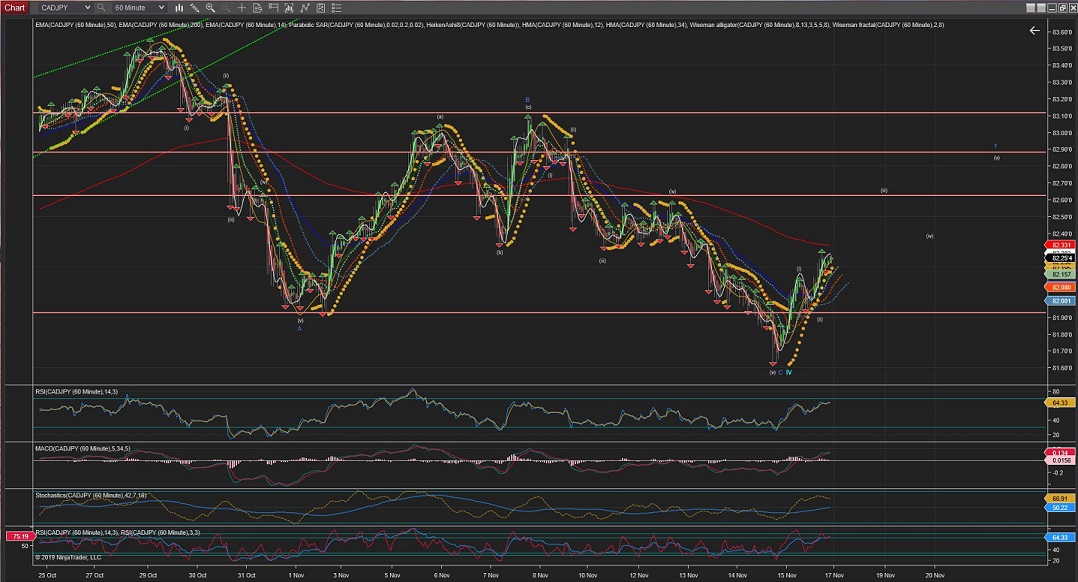
CADJPY 60Min Chart is showing the price moved impulsively in the initial Wave (i) of Wave 1(blue) of Wave v.
And Wave (ii) confirmed as completed as Wave (iii) has started to move already passing through the highest of Wave (i) at 82.12.
Next we should see a continuation of the price moving up steadily and impulsivelly as Wave (iii) developes towards or above the 82.50 price level.
60Mins
4Hours
Daily
Weekly
All the best for everyone and please do not hesitate to contact me if you have any questions or comments.
Andres
info@tradingwaves.org


 Trading Waves .org