Thu 09-05-2019
Hi everyone, hope you are all ok.
USDJPY
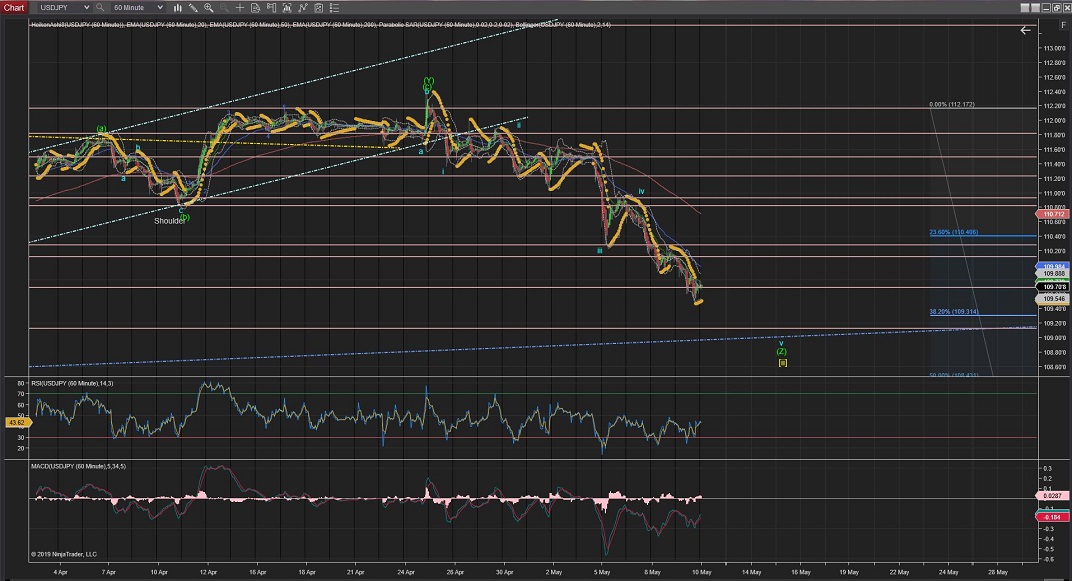
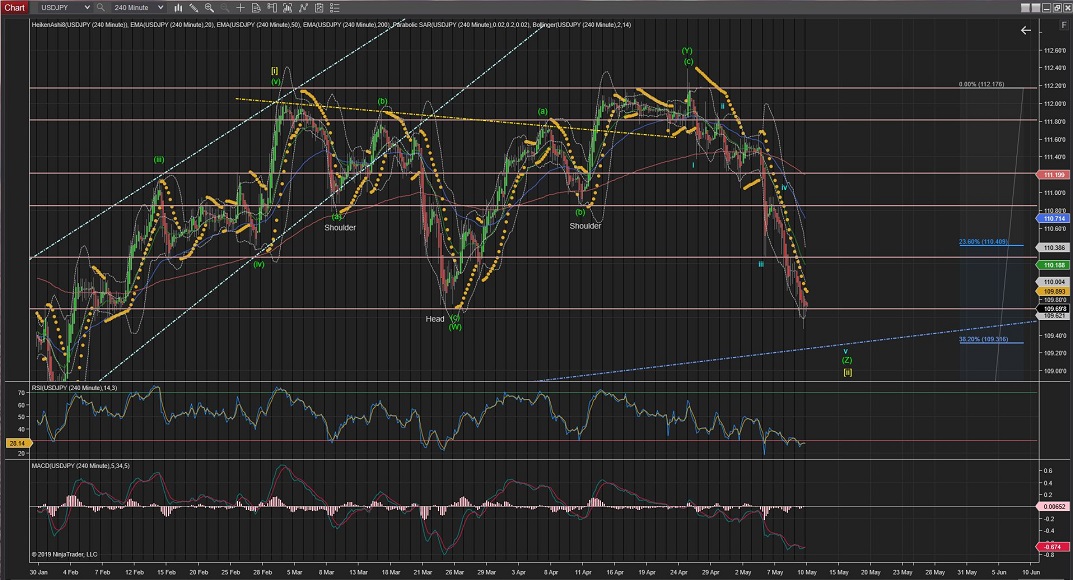
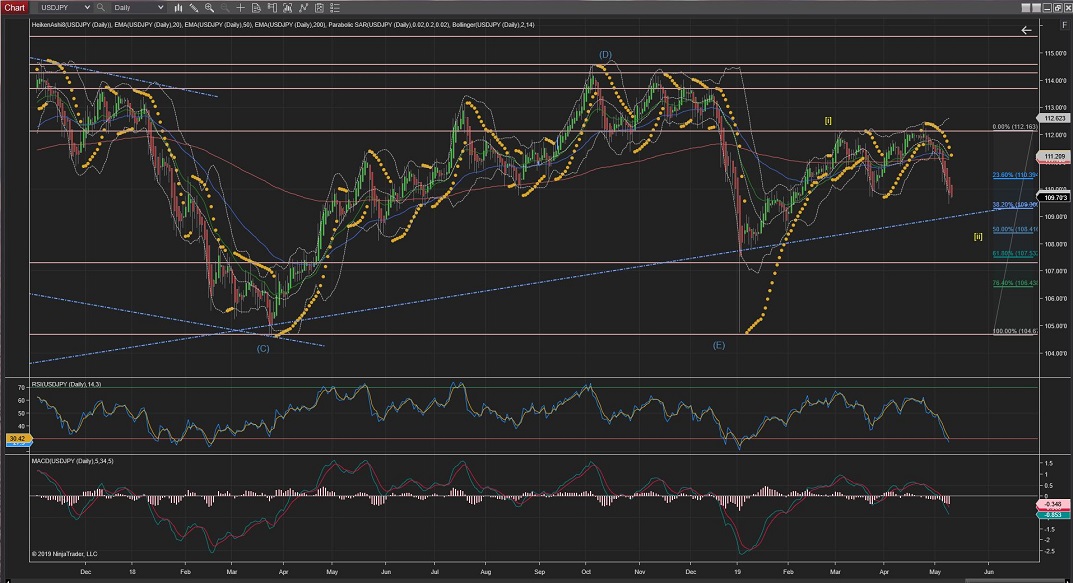
USDJPY Invalidated the count that I had to make an extended Wave [ii] best pictured in the 4Hour and Daily Chart.
The new count is running on its last Wave 5 to complete Wave (Z) of [ii], going towards the lower trend (blue) again at the %38 but likely to get extended towards thew %50 or %62 if breaks out of the trend.
60Mins
4Hours
Daily
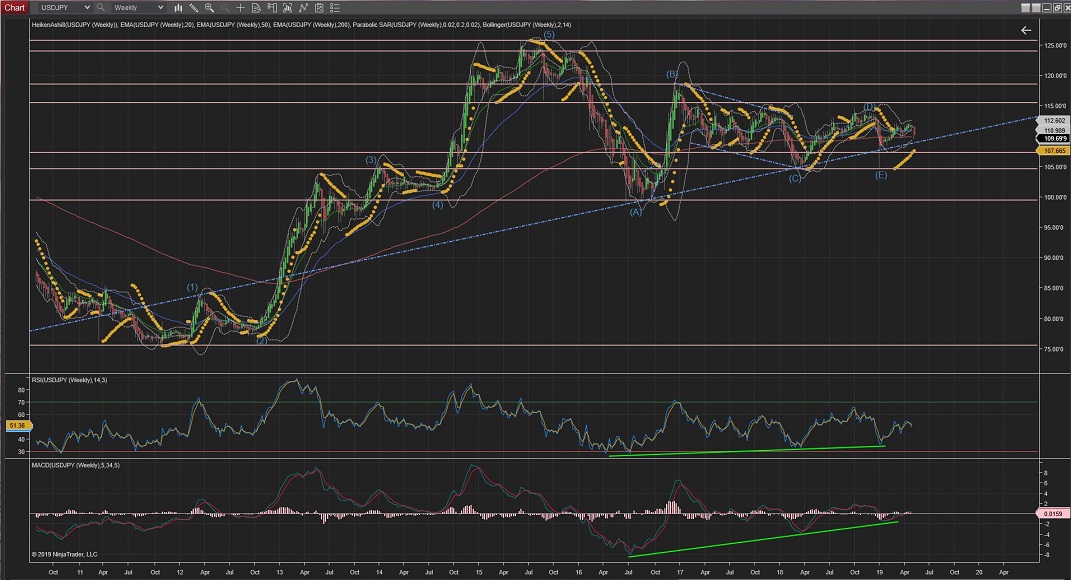
Weekly
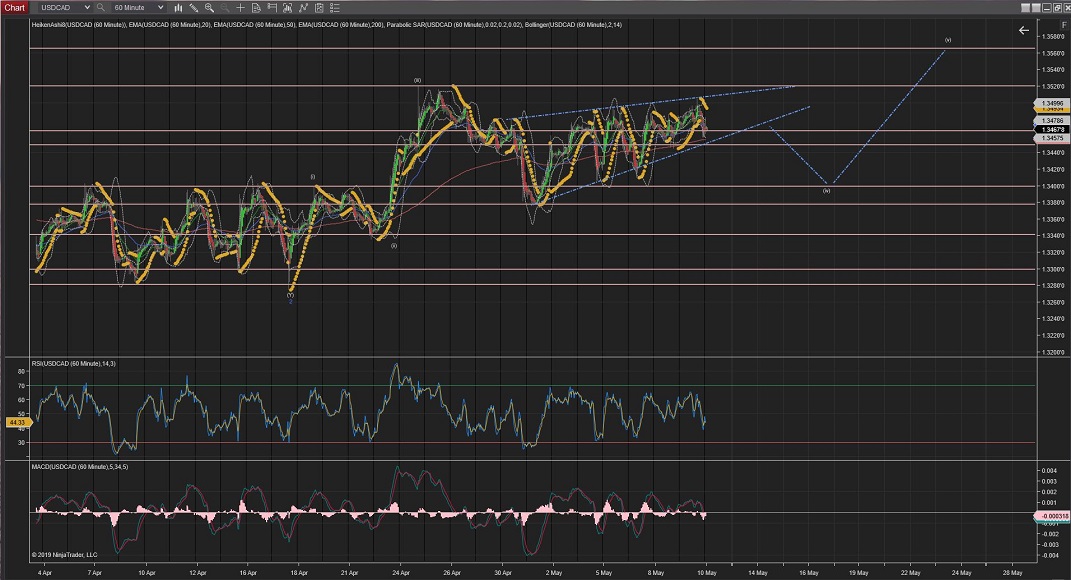
USDCAD
USDCAD since Wave (iv) might not have been completed as it is developing a raising wedge most typical of Wave b corrections.
Once completed, not further than Wave (i) highest at 1.3400, Wave (v) should raise the price hrough the next level of resistance, likely towards the 1.3560 areas of further resistance.
60Mins
4Hours
Daily
USDCHF
USDCHF has reached, and crossed the upper trend confirming Wave [iii] started (best pictured on the Daily Chart).
I havent identified 5 clear Waves that follow the Elliot terms for Wave (i) but nevertheless the move has proved to be the start of Wave [iii] and has picked up momentum to break out of the long term triangle shown on the Daily chart.
The price has managed to sit on top of the upper long term trend which further indicates that Wave [iii] is confirmed to be on the way up; and it has a long way to match the length of Wave [i]; With an initial target for Wave [iii] above the 1.0300 area.
In the hourly chart, the best that I can make for a Wave (i) and Wave (ii) correction is at the point of crossing the upper trend (blue).
With now a current Wave i completed; Wave ii possibly completed soon, Wave iii soon should be underway to potentially cross the next level of resistance at 1.0229.
60Mins
4Hours
Daily
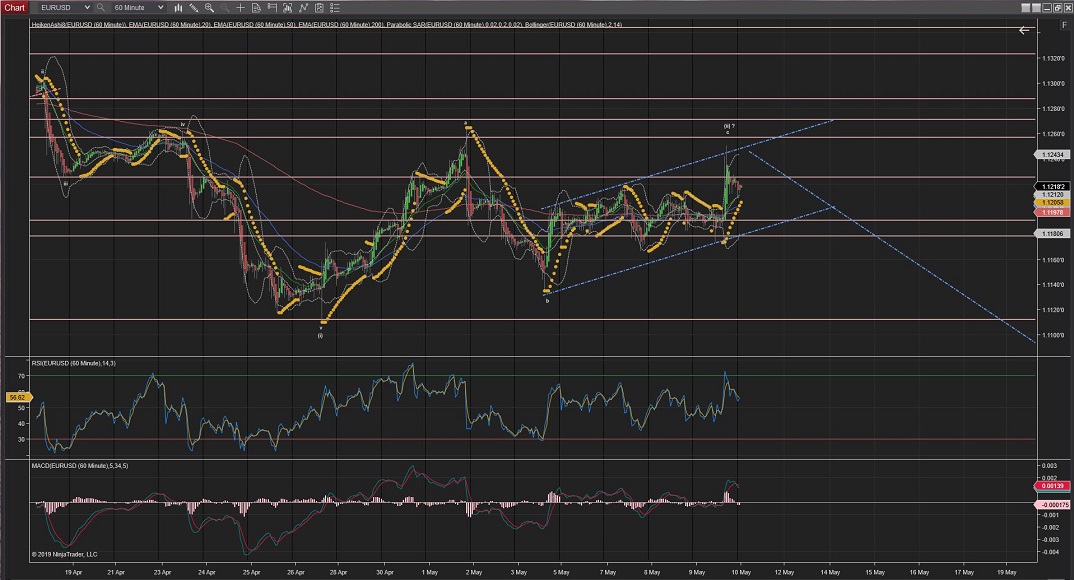
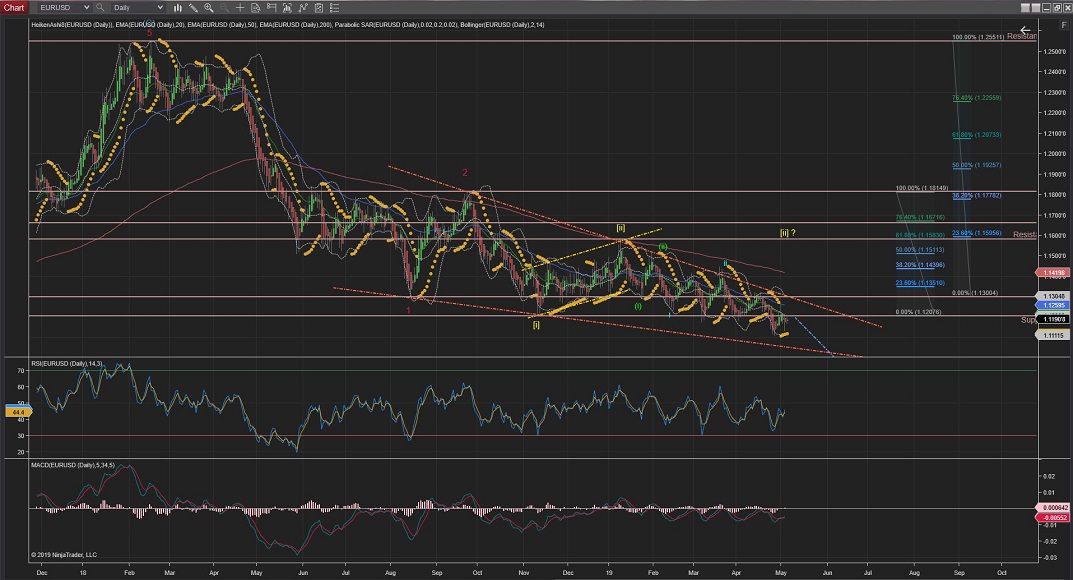
EURUSD
The current count shows Wave (i) completed at 1.1113 and its corrective Wave (ii) to be underway with an ZigZag (5,3,5) going now through Wave c within a trend.
Either way, the main trend continues to be to the downside and Wave (iii) of 3(blue) should start/continue in the next few sessions with continuing impulsive waves.
60Mins
4Hours
Daily
EURCHF
EURCHF Wave (ii) has been developing an expanded flat correction (3,3,5) and seemed to have been completed at just %23 retracement at the 1.1350 area.
The alternative count stands for a lower Wave (ii) heading towards the %50 or %62 Fib retracement.
As for the current count, Wave (iii) should continue taking the price extensively higher on the break out to the upside forming a Cup & Handle pattern; with its current possible internal Wave 3 (blue) underway.
60Mins
4Hours
Daily
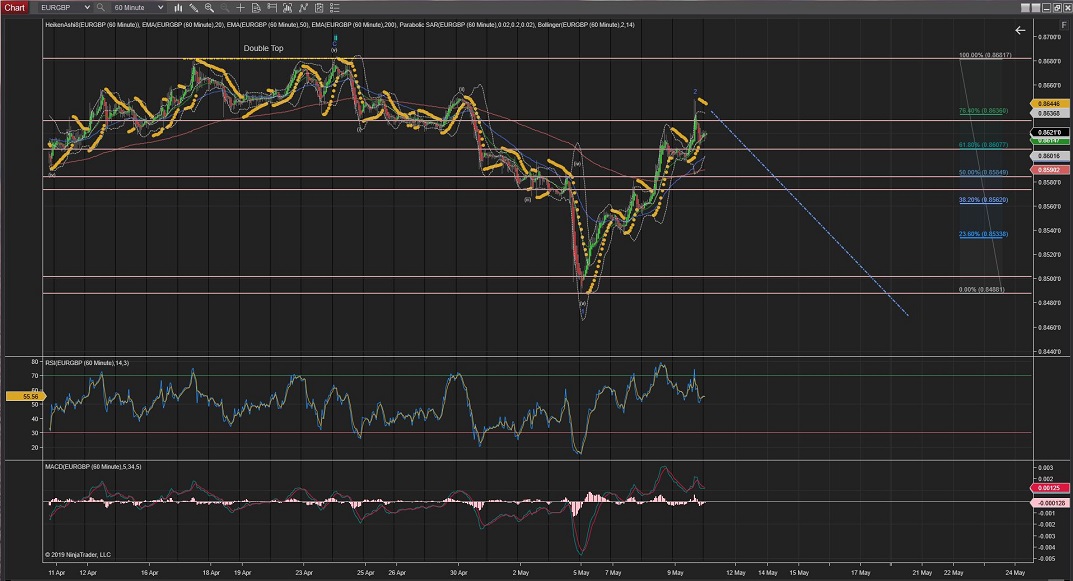
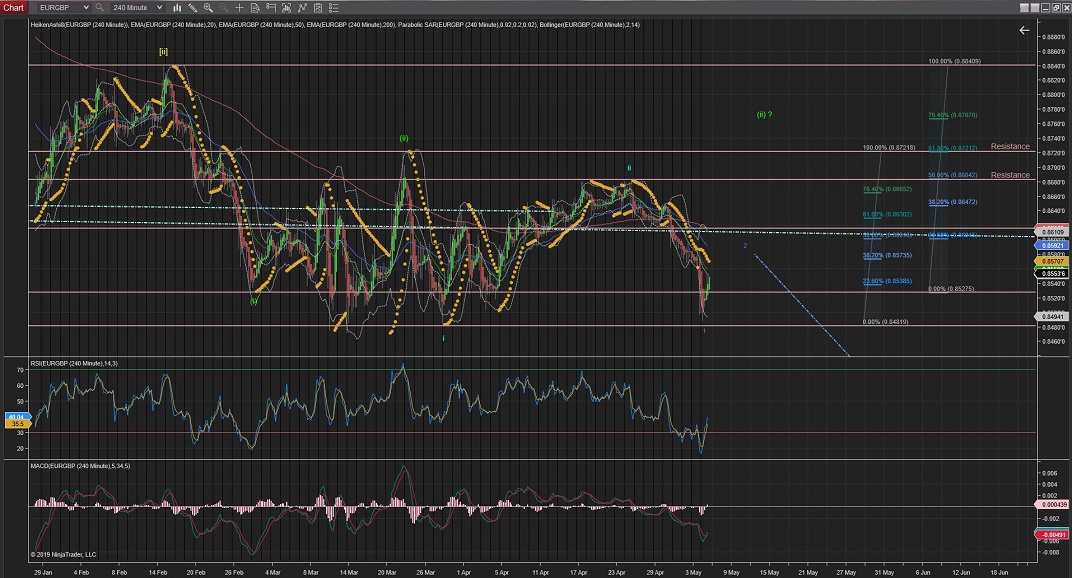
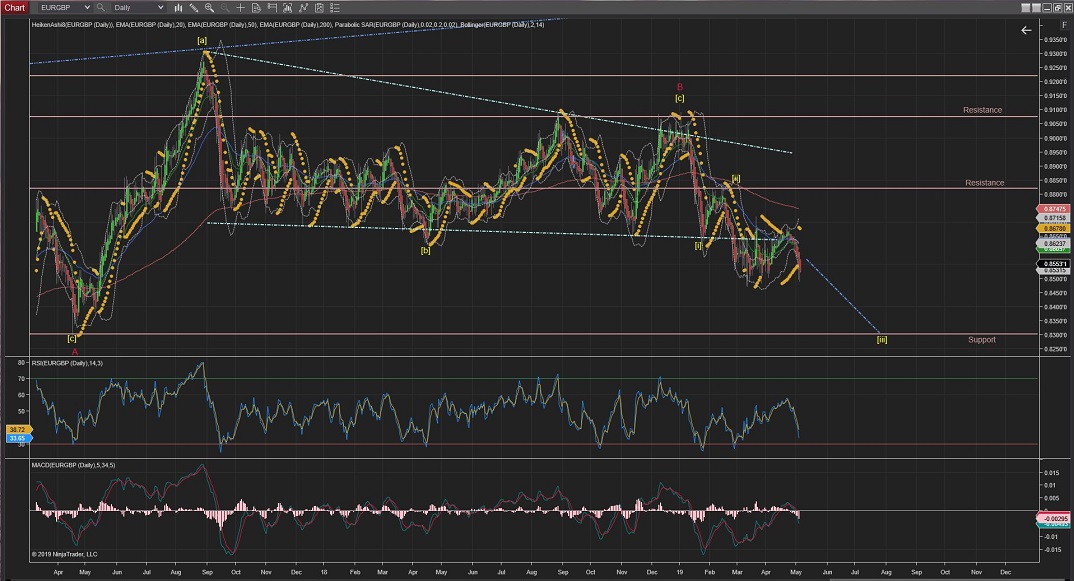
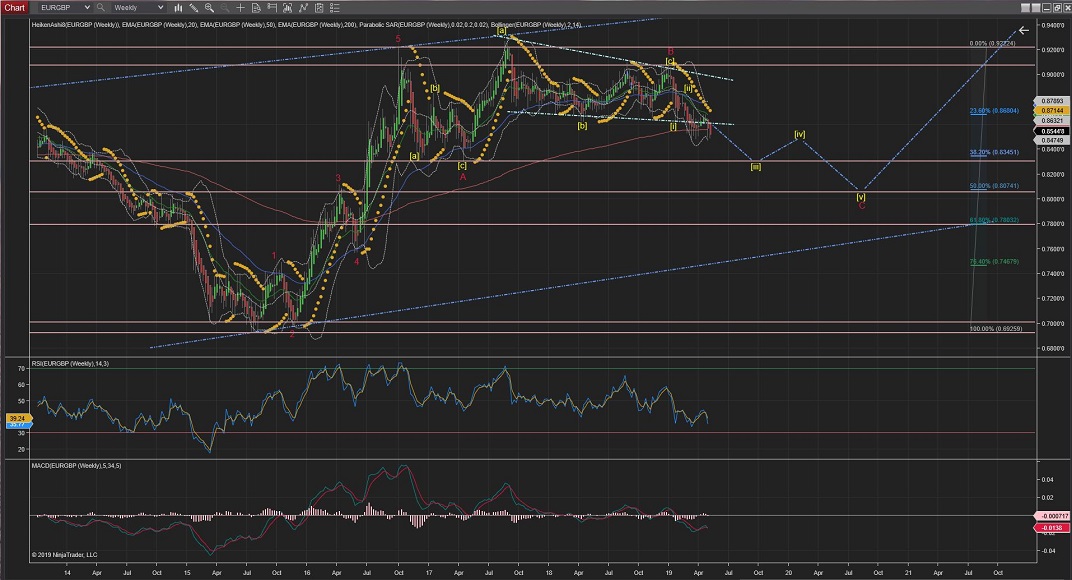
EURGBP
EURGBP Completed at the %76 retracement with a double top.
Since then it moved in 5 very impulsive waves down to complete Wave 1 (blue) of iii at 0.8487.
Next Wave 2 (blue) correction moved up past the %76 Fib retracement to complete a possible ZigZag (5,3,5) corrective pattern.
So now Wave 3 should get underway with impulsive moves to the downside again.
(the highest of Wave 1 at 0.8681 should not be crossed for this count to remain valid)
60Mins
4Hours
Daily
Weekly
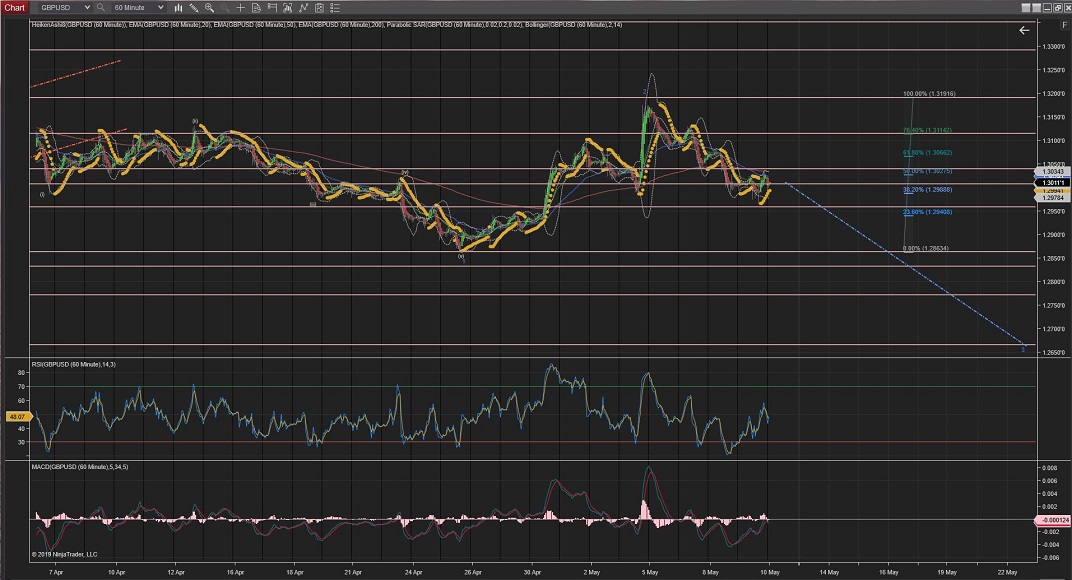
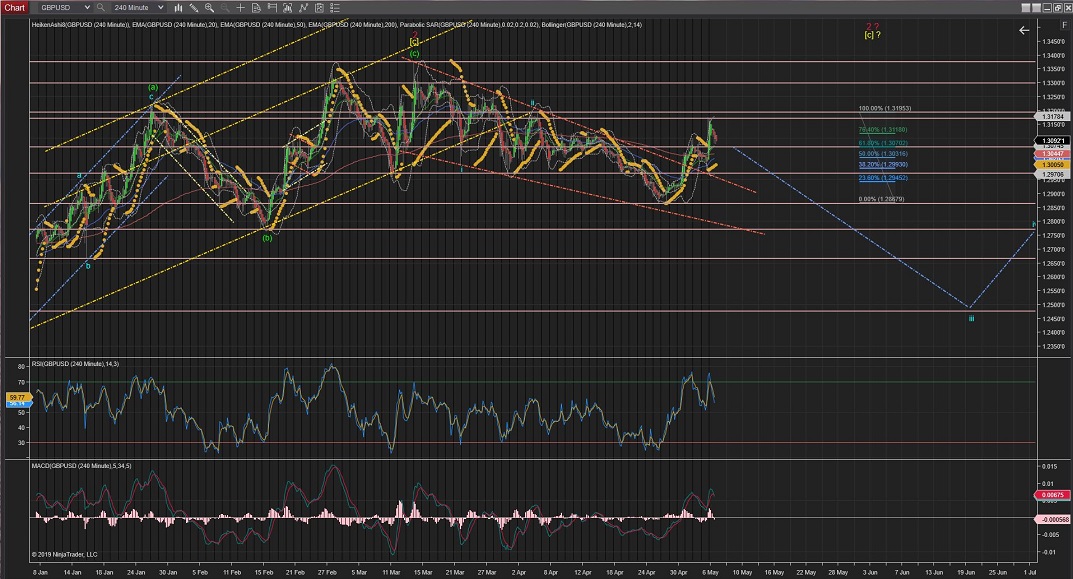
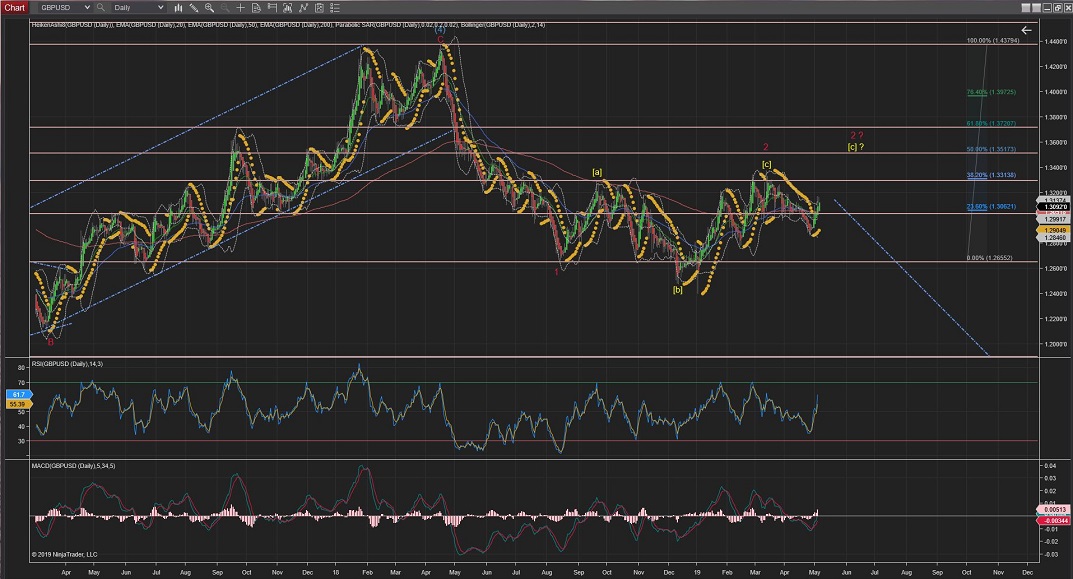
GBPUSD
GBPUSD almost invalidated the current count by risen to nearly 0 retracement of Wave 1 (blue).
Note: the Daily Chart shows a further alternative count for an Extended Wave [c] correction to complete Wave 2(red) at the %50 retracement level (1.3517 area).
As per current count; Wave 3 (blue) should show further impulsive waves to the downside crossing the lowest of Wave 1 at 1.2865 and with a target towards support levels at 1.2660 area.
60Mins
4Hours
Daily
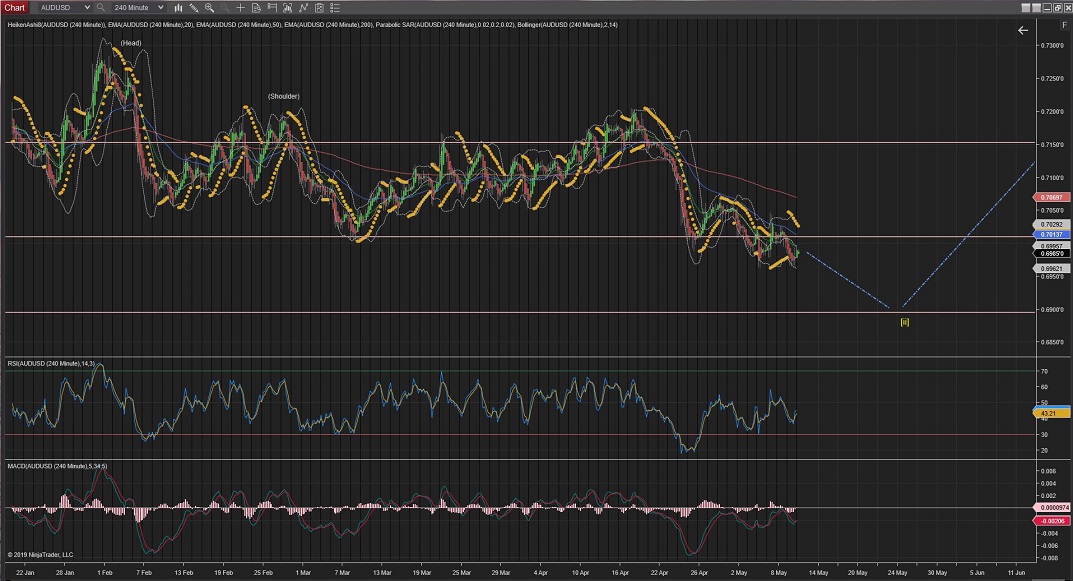
AUDUSD
Daily & 4Hour Charts:
AUDUSD 4Hour Chart has been showing the price raising from the neckline of a clear Head & Shoulders pattern which was suggesting Wave (iii) could have been finally making its way up.
Still not out of the woods yet, and the last recent further moves lower towards this neckline has been aleerting of the alternate count.
Moves lower than this neckline could trigger the alternative count for an extended Wave [ii] going towards the %76 levels of support, although it is still possible an extended Wave [v] or even a further extended Wave 5, with not much resistance levels to stop the move down (best seen in the 4Hour and Daily charts) .
Hourly Chart:
Is playing a very awkward and hard to follow series of waves and, as best as I can follow on this pair, and as it stands I will wait for the price to reach the neckline and let the price decide from there the trend direction for the next count
60Mins
4Hours
Daily
Weekly
All the best for everyone.
Andres


 Trading Waves .org