Mon 29-04-2019
Hi everyone, hope you are all ok.
USDJPY
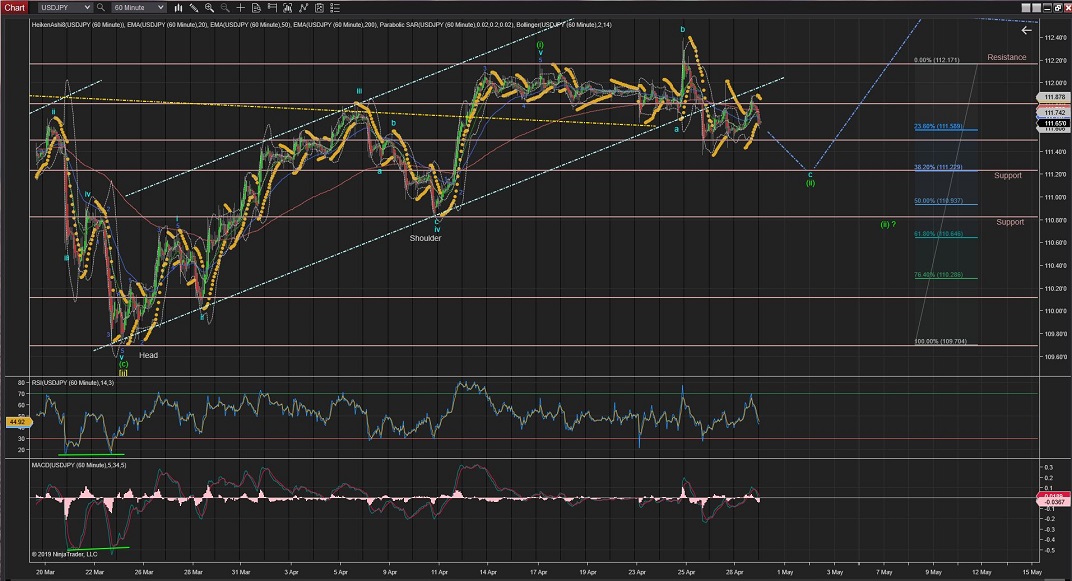
USDJPY Wave (ii) expanded Flat correction is still underway, with its internal Wave c yet to be completed.
Once completed, Wave (iii) of [iii] will start and the price should raise higher impulsively.
60Mins
4Hours
Daily
Weekly
USDCAD
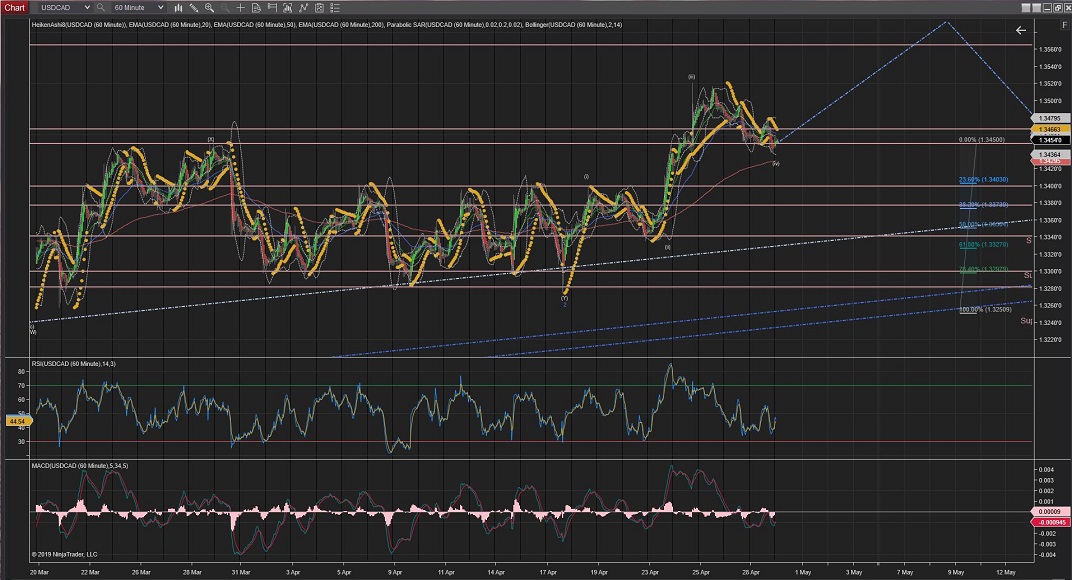
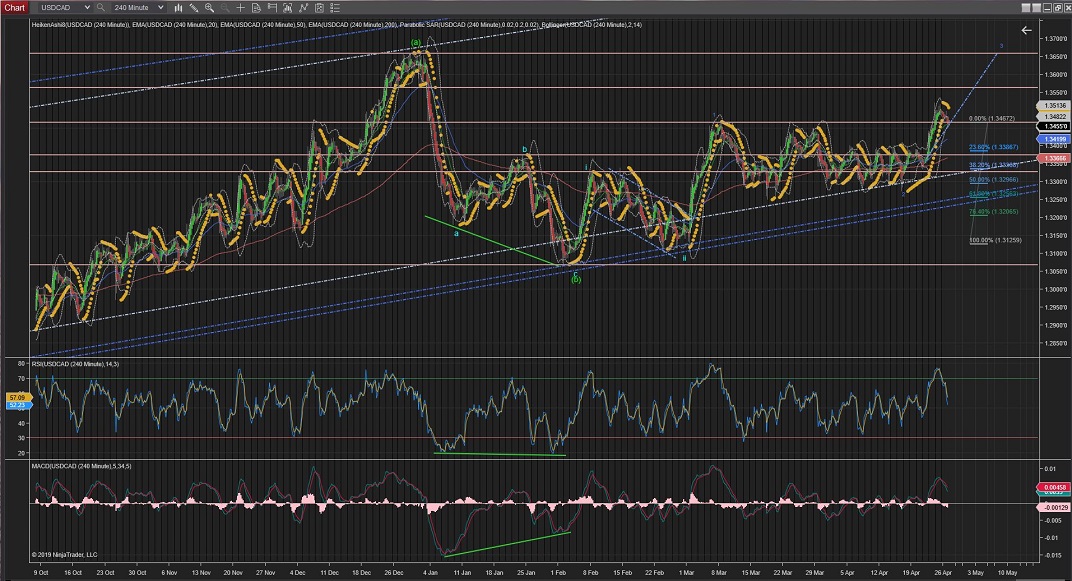
USDCAD completed Wave (iii) at 1.3519 and today might have completed Wave (iv) correction.
The highest of Wave (i) at 1.3400 should now support the price from droppping lower, should the price fall lower.
Once Wave (iv) is completed, Wave (v) should carry the price higher in an impulsive fashion again, likely towards the 1.3560 areas of resistance.
60Mins
4Hours
Daily
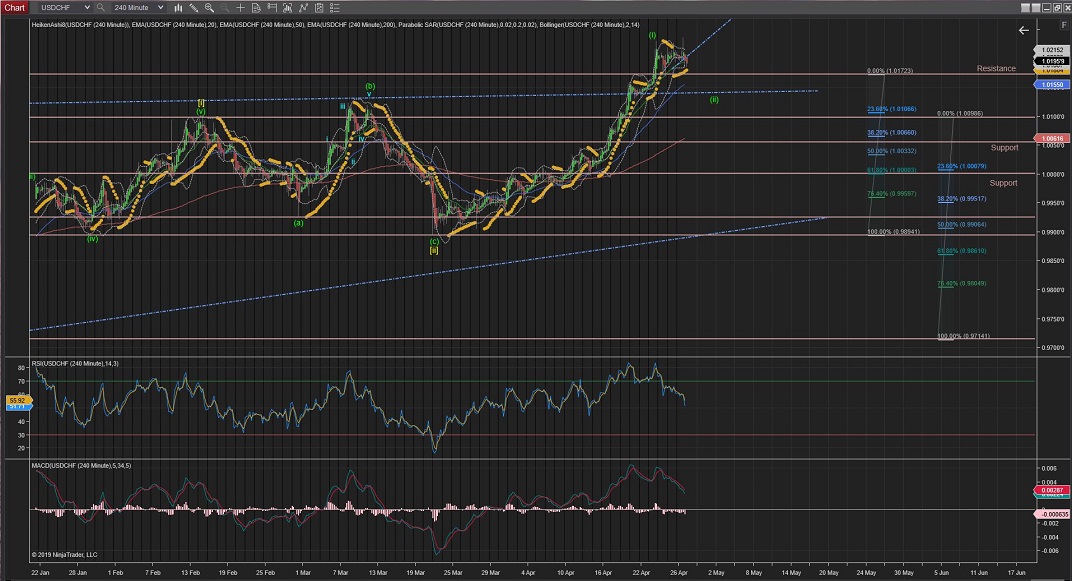
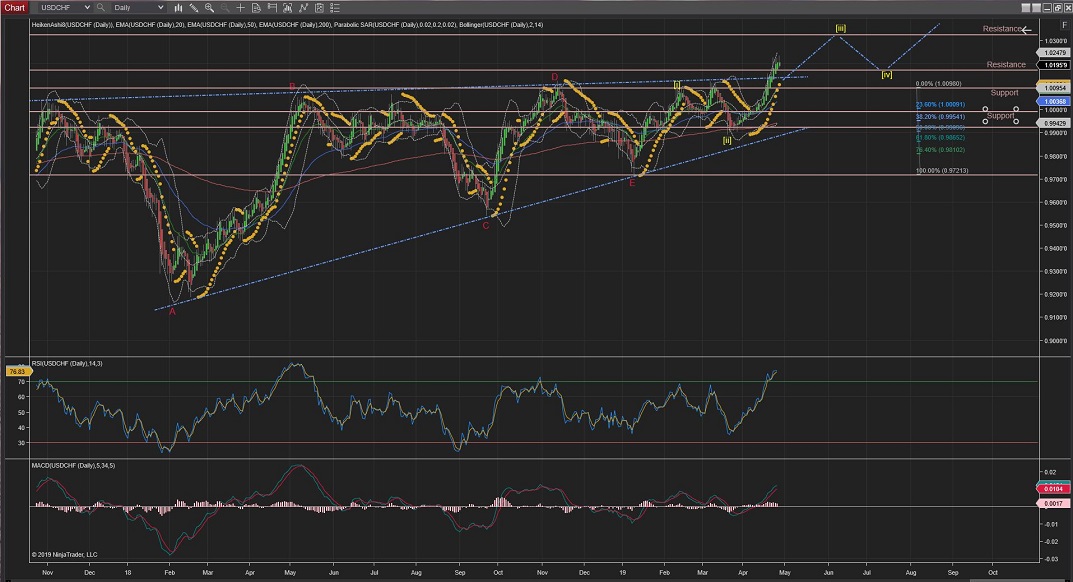
USDCHF
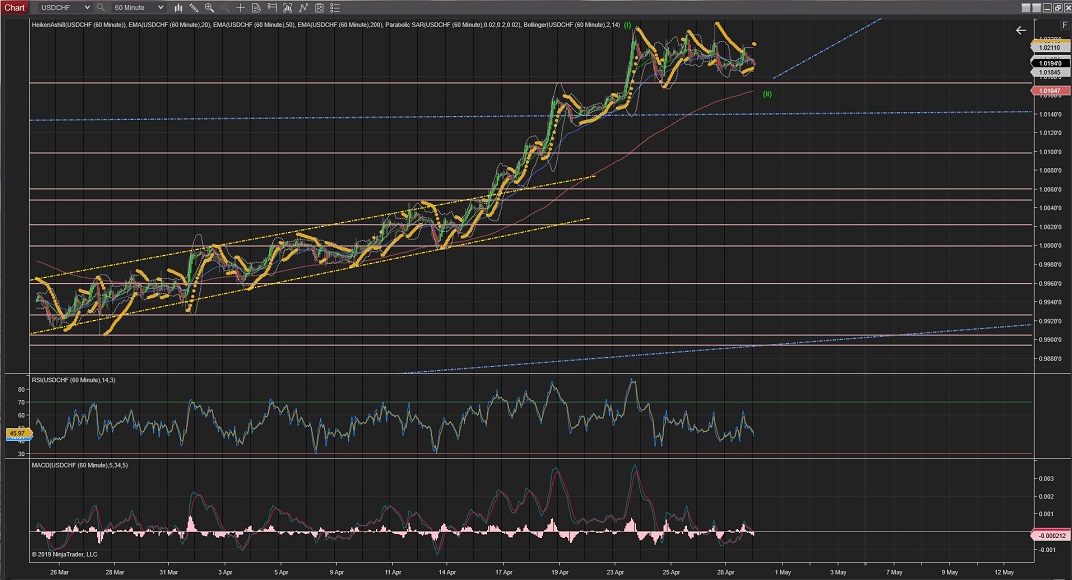
USDCHF has finally reached, and crossed the upper trend confirming Wave [iii] started (best pictured on the Daily Chart).
I can still not distinguish 5 clear Waves that follow the Elliot terms for Wave (i) but nevertheless the move has proved to be the start of Wave [iii] and has picked up momentum to break out of the long term triangule shown on the Daily chart.
In the hourly chart, the best that I can make for a Wave (i) and Wave (ii) correction is at the point of crossing the upper trend (blue).
I would expect another small correction towards the trend again but Wave [iii] has already confirmed to be on the way up; and it has a long way to match the length of Wave [i]; With an initial target for Wave [iii] above the 1.0300 area.
60Mins
4Hours
Daily
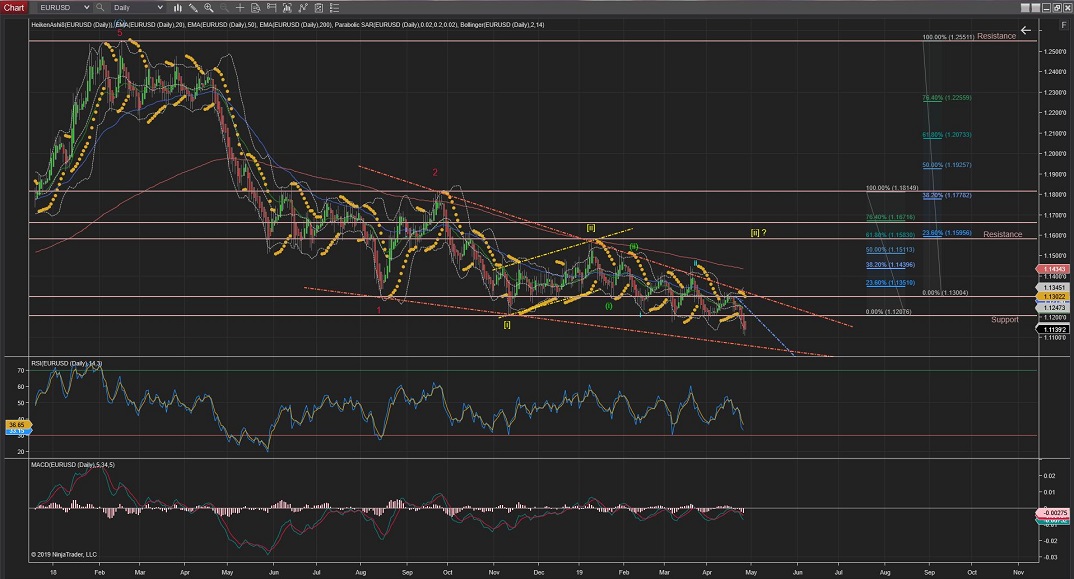
EURUSD
EURUSD Wave (iv) correction continued today and seems to be running out of steem but has not shown confirmation of its completion yet.
(Note that the price should not cross the lowest of Wave (i) at 1.1225 for this count to remain valid)
Next, upon Wave (iv) completion, we should see the impulsive waves to continue to the downside for Wave (v);
The next support level lies at 1.1060, where a long-term trend line lies (best shown on the 4Hour and Daily charts).
60Mins
4Hours
Daily
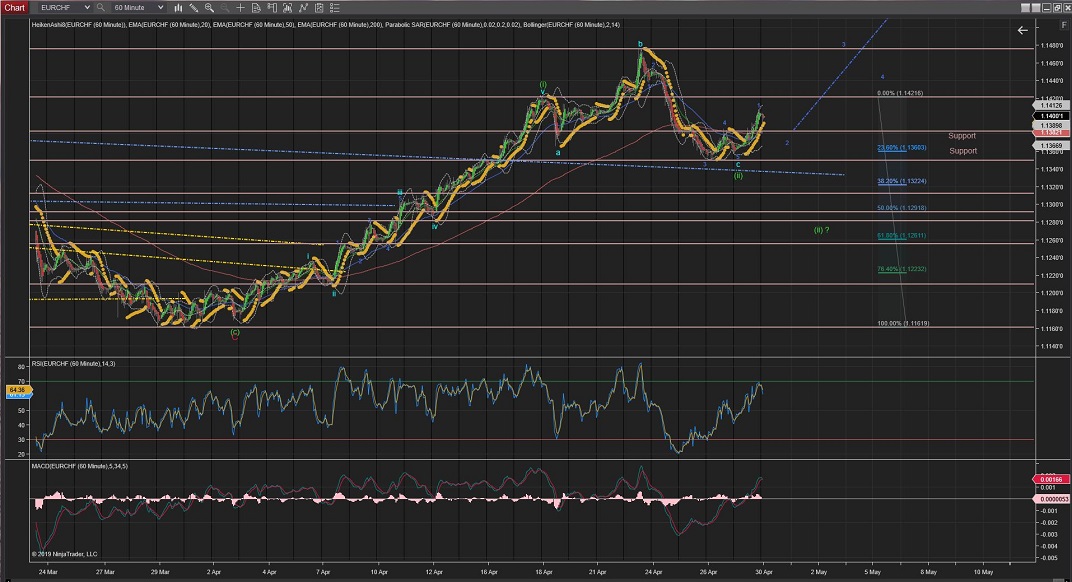
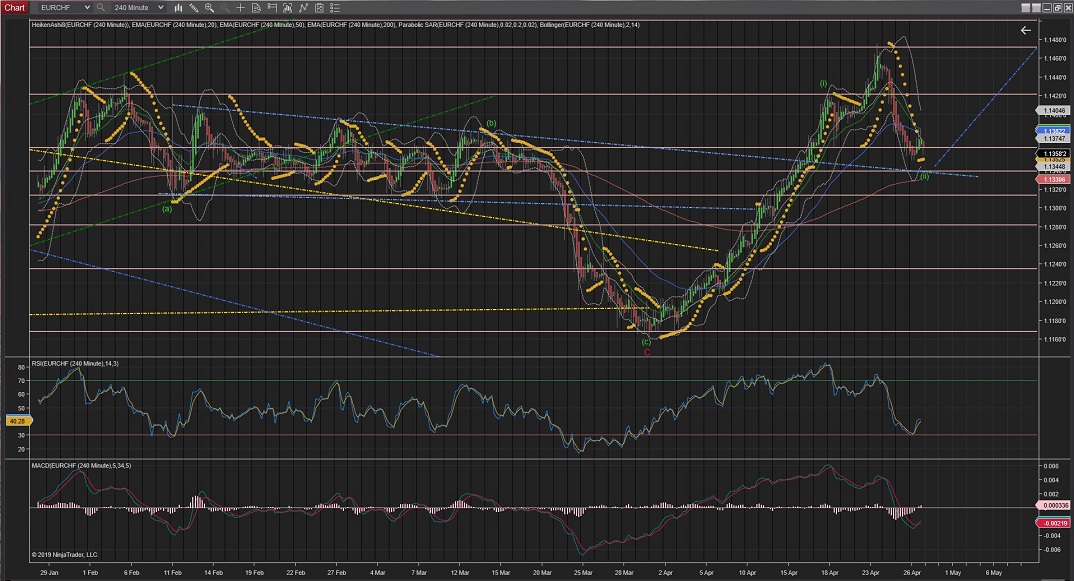
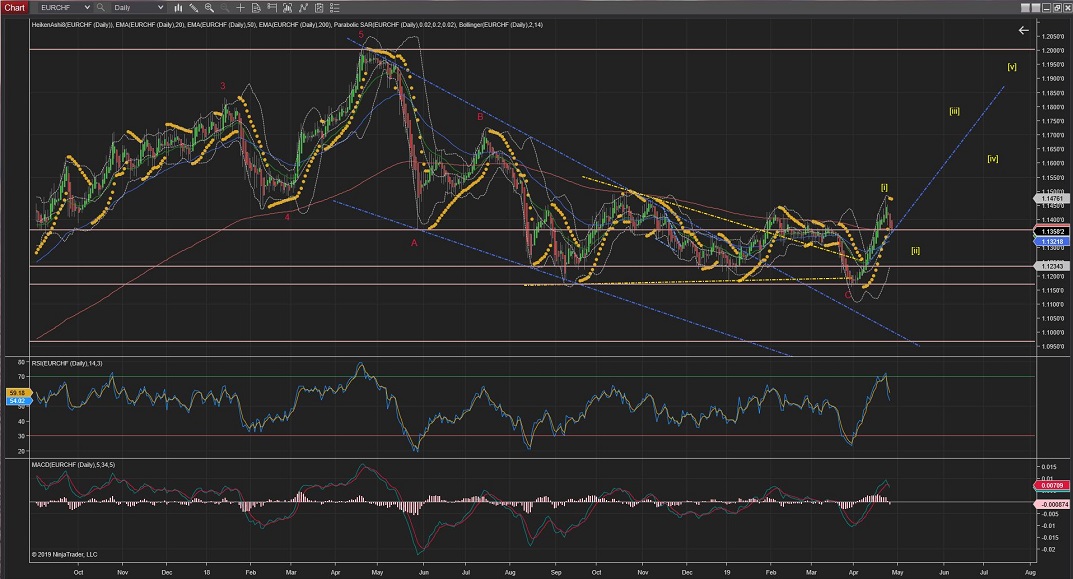
EURCHF
EURCHF Wave (ii) has been developing an expanded flat correction (3,3,5) and seemed to have been completed at just %23 retracement at the 1.1350 area with a failed Wave 5 that completed Wave c of (ii).
Should it continue lower tomorrow and this support get violated, the next big levels of support would be bethween the %50 and the %62 Fib retracement around the 1.1280 area.
As for the current count, Wave (iii) should continue taking the price extensively higher on the break out to the upside forming a Cup & Handle pattern.
60Mins
4Hours
Daily
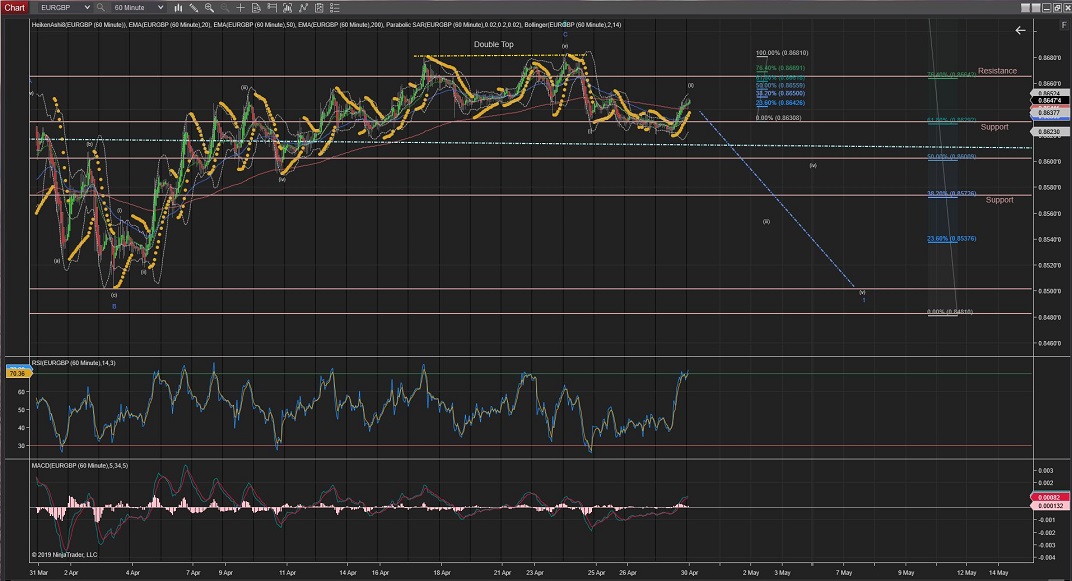
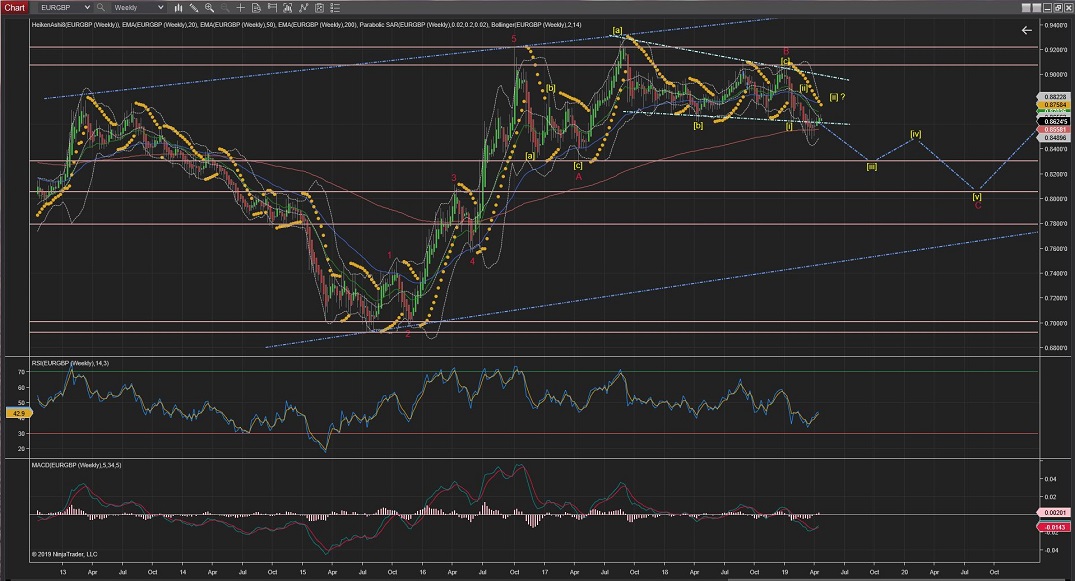
EURGBP
EURGBP is been moving in a corrective manner for a while on Wave ii and completed at the %76 retracement with a double top.
Note: There is potential for an extended Wave (ii) as an alternative count and the daily chart also shows an alternative count for a larger Wave [ii] to extend further.
As for the current count; Wave 3 should continue the impulsive waves down, after the current retracement for Wave (ii) expanded flat correction; Taking the price towards the 0.8500 support levels to complete its initial Wave 1 (blue).
60Mins
4Hours
Daily
Weekly
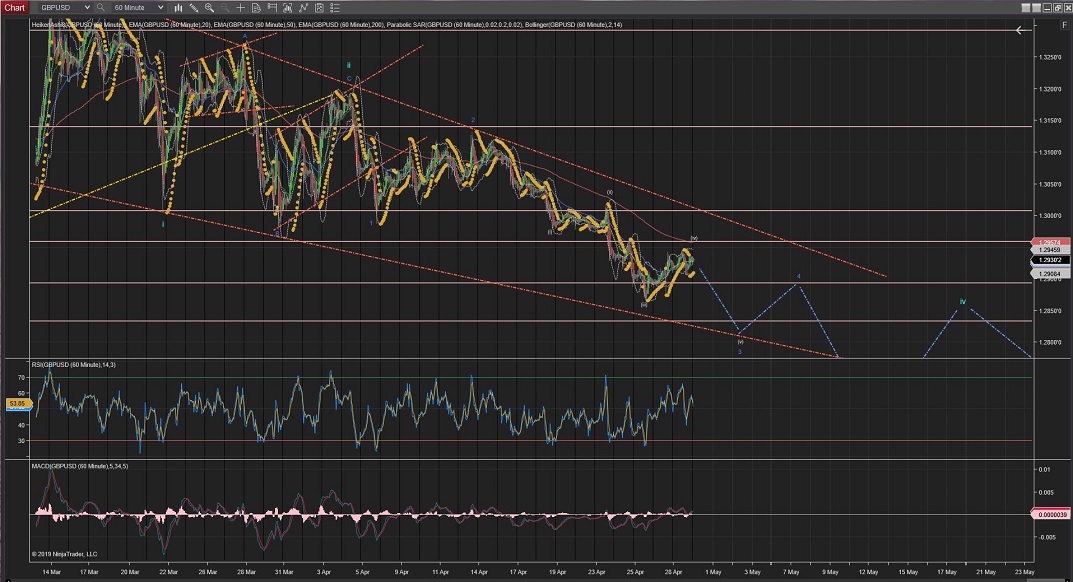
GBPUSD
GBPUSD is been moving slowly downwards and now seems to have just completed Wave (iv) of Wave 3 of iii.
I have updated the charts for a more clear count, although the direction has not been afected.
Note: the Daily Chart shows an alternative count for an Extended Wave [c] correction to complete Wave 2(red) at the %50 retracement level (1.3517 area).
As per current count, Wave iii was confirmed as it crossed the lowest of Wave (i) at the 1.3000 level area and should continue lower towards the 1.2750 area for its completion.
Once current Wave 3 is completed, Wave 4 correction should take place; which should raise no higher than Wave 1 low at 1.3008.
60Mins
4Hours
Daily
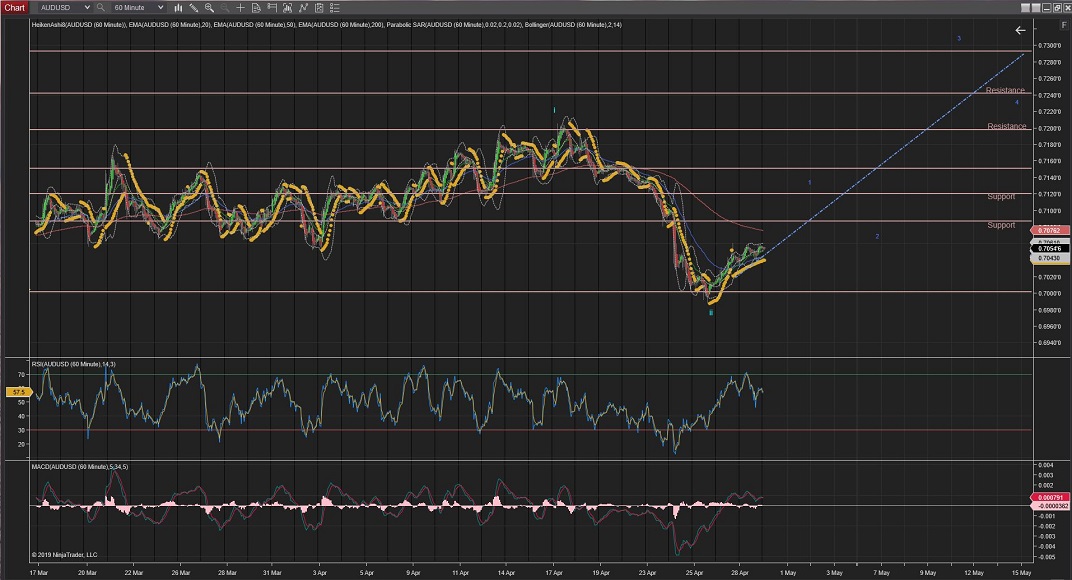
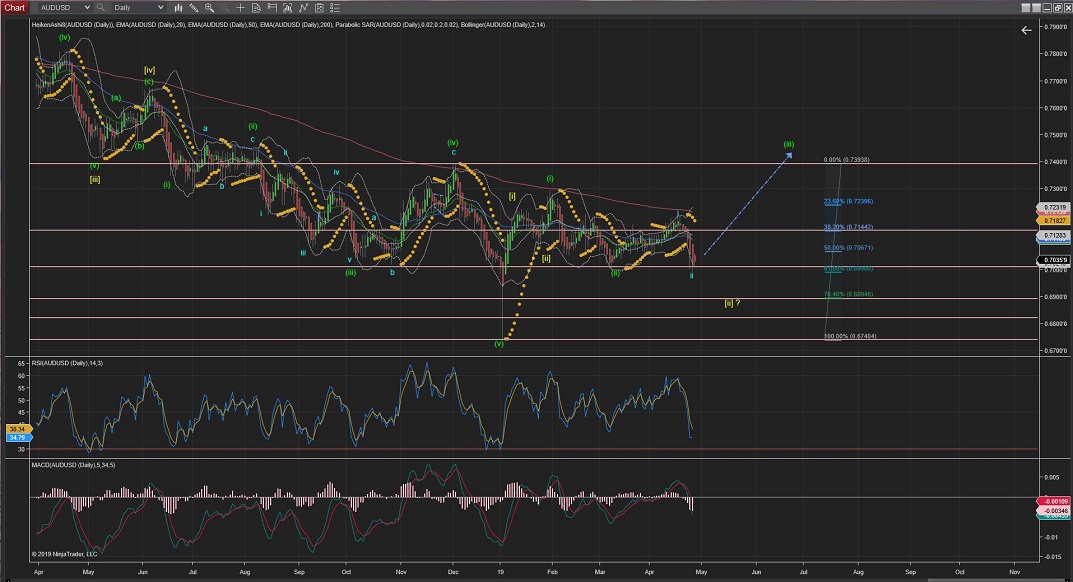
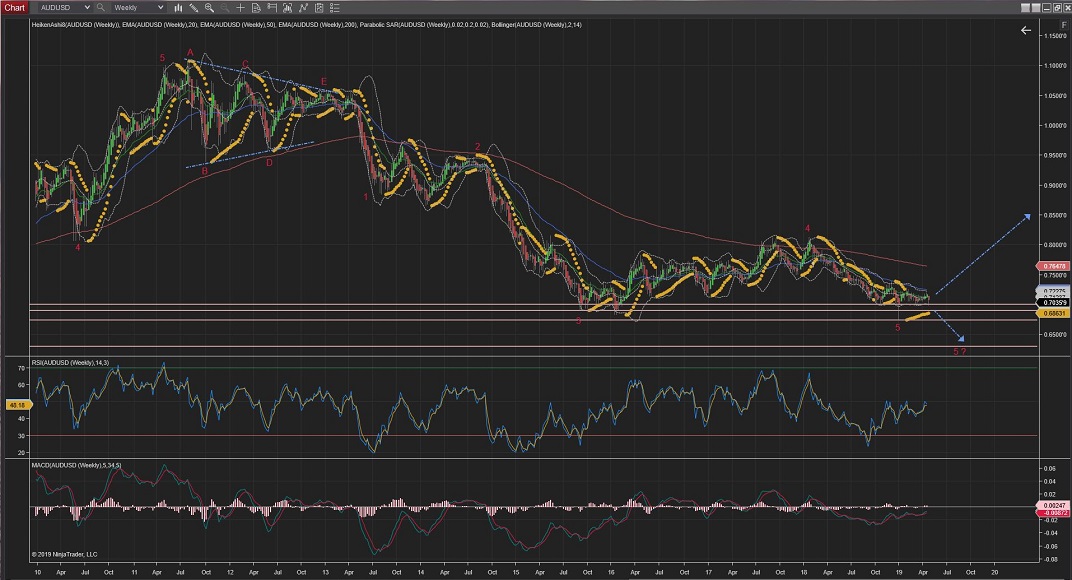
AUDUSD
Daily & 4Hour Charts:
AUDUSD 4Hour Chart is showing the price raising from the neckline of a clear Head & Shoulders pattern which is suggesting Wave (iii) could be finally making its way up.
Still not out of the woods yet, so further moves lower than this neckline would trigger the alternative count for an extended Wave [ii] going towards the %76 levels of support, although it is still possible an extended Wave [v] or even a further extended Wave 5, with not much resistance levels to stop the move down (best seen in the 4Hour and Daily charts) .
Hourly Chart:
Is playing a very awkward and hard to follow series of waves and, as best as I can follow oin this pair, the current action shows Wave i and ii extended waves.
Next, for the bullish count to remain, Wave 3 should raise in its 5 internal waves up, possibly to the next resistance level around the 0.7300 area.
60Mins
4Hours
Daily
Weekly
All the best for everyone.
Andres


 Trading Waves .org